Two gauges.
One read on the market.
AlphaPulse Terminal turns global news, macro data, and market anomalies into two numbers per topic - how the market feels, and how closely it's watching. Here's what they mean and how to read them.
150+
Tracked topics
12
Signal domains
3yr
History (Pro)
24/7
Continuous updates
1M+
News stories / day
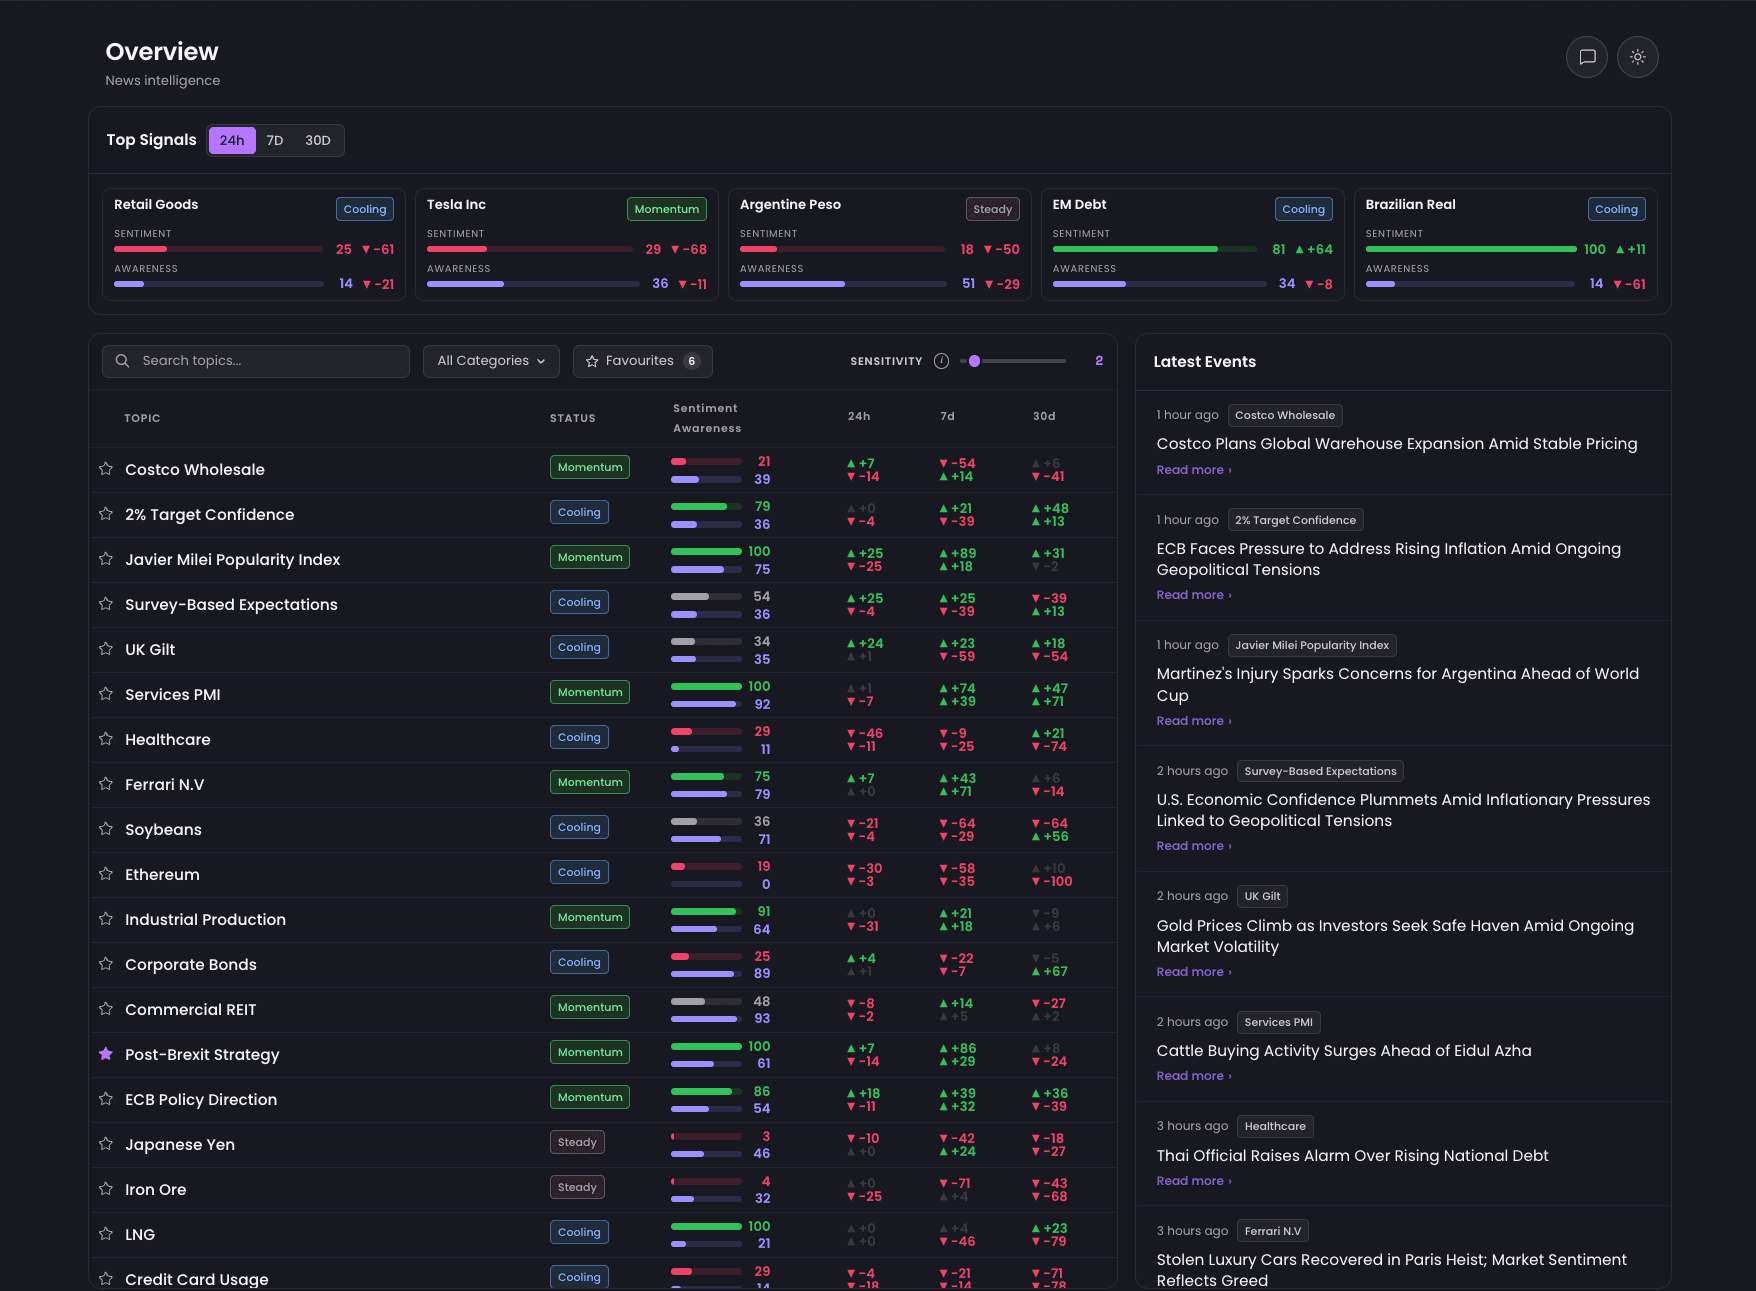
What it looks like
Every topic gets its own page
Seen in
"Trump Fear Index - Ukrainians in Poland built a future-predicting tool that monitors global reactions to Trump's rhetoric in real time."
Read article"Does the world fear Trump? A Kraków startup launched a free AI-powered tool that tracks real-time sentiment across media and social platforms."
Read article"Alpha Data Analytics merges with MEELY - early coverage of the company's origins and its expansion into sentiment analysis."
Read articleCoverage
Every major market. One platform.
150+ topics across 12 domains - all driven by the same underlying AlphaPulse signal engine.
Reading the dashboard
What the numbers mean
Every topic page shows two gauges, scored 0-100. One measures tone, the other measures attention - together they tell you not just what the market thinks, but how loudly it's saying it.
Pulse Strength
The tone gauge. It scores where sentiment sits on a scale built for that topic - Fear ↔ Greed, Bearish ↔ Bullish, Dovish ↔ Hawkish, and nine other pairs depending on what the topic actually measures.
Attention Pulse
The awareness gauge. It scores how much coverage a topic is getting right now, from Very Low to Top - a rising score means more of the market is watching, regardless of whether the news is good or bad.
The 5 color zones
Both gauges use the same 20-point bands: extreme-negative, negative, neutral, positive, extreme-positive. A gauge sitting deep in red or deep in green is the flag worth reading first.
Signal tags
Short-hand labels on the topic table - Spike (coverage surging), Momentum (tone and coverage rising together), Bearish, Cooling, Elevated, Low Interest, Steady - so you can scan a whole domain in seconds.
History chart
Plots the same 0-100 score over time - 24H up to 3Y on Pro. Use it to see whether today's reading is a genuine turn or noise inside a longer trend.
Free vs. Pro
Free shows today's gauges and tags on every topic. Pro unlocks full multi-year history and faster refresh, for confirming a move instead of just spotting it.
Founders' perspective
The AlphaPulse Story
Too much information. Too little signal. Three founders who spent years collecting world events data before a company even existed - read how AlphaPulse went from a frustration to a platform.
How it works
From raw data to actionable signals
Ingest
We continuously ingest thousands of global news sources, macro releases, and market data feeds - 24 hours a day.
Analyse
Our AI models score sentiment, detect momentum shifts, and identify coverage spikes across 150+ financial topics.
Signal
Each topic surfaces a structured signal - bullish, bearish, or neutral - with strength scores updated continuously.
Pricing
Start free. Go Pro when you're ready.
Free forever for the basics. Subscribe per category, or go flat for all of them.
Free
Free forever€0/ month
Get started in 30 seconds.
- Delayed signal deliveryup to 24h
- Access to 12 categories & topics
- 1 active Volatility alert
Pro · Single Category
2 weeks free€29/ month
Choose one category.
- Algorithmic trade ideasUnlimited
- Data updatesHigh frequency
- 5 active Volatility alerts
- API access, CSV export & 3-year history1 Category Only
Pro · All Categories
Popular€149/ month€348
Everything.
- High frequency data updates across all topics
- Unlimited Volatility & cross-category Priority alertsUnlimited
- Uncapped API access & CSV exports for all 12 categories
- Cross-category Time Series analytics
Get started
Start reading the market differently.
Free tier, no credit card. Upgrade to Pro when you need real-time signals and the full history.