Bitcoin Nears $75,500 Support as Fear Rises

Bitcoin is trading just above a key lower range band, and the market is now focused on whether a flush to about $75,500 will clear out leveraged longs before any rebound takes hold.
That setup matters because the crypto market is showing classic late-downtrend behavior: downside momentum is still in place, but price is pressing into an area where prior buyers have tended to step back in. Bitcoin was last around $77,437, not far from the lower Bollinger Band near $76,145 and above the 200-day moving average at roughly $70,092, while the 50-day average sits higher at about $70,912. The gap between those averages and spot underscores how far the recent pullback has already compressed price structure, even after a sharp run-up earlier in the cycle.
The technical picture still leans bearish in the near term. The relative strength index on the latest reading was 47, leaving momentum neither oversold nor supportive of an immediate trend reversal, while the MACD remained positive but below its signal line, indicating fading upside momentum. Michaël van de Poppe’s call for a sweep of the $75,500 area fits that backdrop: a quick push below nearby support would likely trigger stop-loss selling and liquidation of crowded positions before allowing a cleaner base to form.
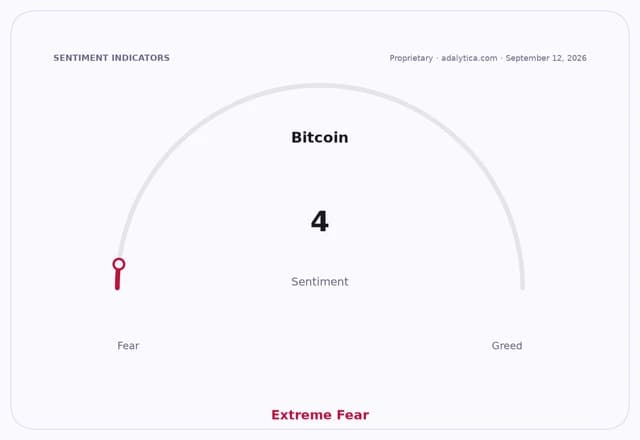
The macro and market tone is also risk-off. Adalytica’s Bitcoin Fear & Greed Index shows “Extreme Fear” at 4, down sharply over the past month, suggesting sentiment has already washed out. That is often constructive for longer-term holders, but in the short run it can also mean more forced selling if support gives way. At the same time, broader risk assets are weak, with the S&P 500 signal also in “Extreme Fear,” limiting the case for an immediate, sentiment-led rebound across speculative assets.
For investors, the key issue is not just whether Bitcoin holds $75,500, but whether the market uses that area to reset positioning. A brief sweep lower could improve the odds of a technical reversal if it drains leverage and restores demand. But a sustained break below that zone would expose Bitcoin to a deeper test of the low-$70,000s, where the 200-day average and longer-term trend support sit.
The bull case is straightforward: fear is already extreme, support is tightly clustered and a liquidity flush could set up a sharp countertrend bounce. The bear case is that repeated tests of support usually weaken it, and if Bitcoin cannot reclaim the upper end of the range, traders may start treating every bounce as a selling opportunity rather than the start of a durable recovery.
| Entity | Gains | Losses |
|---|---|---|
| Short-term bears | ▲Liquidity flush | ▼If support holds |
| Long-term buyers | ▲Lower entry levels | ▼If selling accelerates |
| Leveraged longs | ▲Temporary reset | ▼Stop-outs and liquidations |
| Bitcoin miners/holders | ▲Rebound on bounce | ▼Mark-to-market pressure |