Costco vs. Walmart: Consumer Read Split

Walmart’s recent deceleration looks less like a clean read on the American consumer and more like a reminder that not all discount traffic is created equal, with Costco continuing to show the stronger operating and stock-market case.
For investors trying to gauge household health, the divide matters because the cheapest, broadest retailer is not automatically the best proxy for spending stress. Walmart serves a very large share of lower-income and value-conscious shoppers, but its performance can be distorted by mix shifts, competitive intensity and execution. Costco, by contrast, has been taking share from shoppers willing to pay membership fees for bulk value, perceived quality and a tighter, more efficient shopping experience.

That distinction shows up in the market. Costco’s shares have held up much better than Walmart’s in recent trading, suggesting investors still see the warehouse club as a premium defensive compounder rather than a pure barometer of consumer strain. COST closed at $956.99 on Aug. 19, up slightly from $953.50 on Aug. 17, and remains just above its 200-day moving average of $956.47. Walmart, meanwhile, ended Aug. 19 at $114.30, below its 200-day average of $118.21, after sliding from $115.20 the prior day.
The technical picture reinforces the gap in sentiment. Costco’s 50-day moving average is $948.70 and its relative strength index was 51.8 on the latest reading, a sign of a stock that has recovered from earlier volatility and is back near equilibrium. Walmart’s RSI was 65.5, but the stock still trades under its long-term average, reflecting a market that has already discounted some of the chain’s recent operational softness. Neither set of indicators says much about the consumer alone; together they show investors are assigning more credibility to Costco’s model than to Walmart as a read-through on spending.
That split also fits the broader retail landscape. Regional grocers can often look better than Walmart for shoppers who want convenience, quality and store proximity, while Aldi tends to win on extreme budget sensitivity. Costco sits in a different lane altogether: it benefits from affluent and middle-income households trading up in value, not just from consumers trading down in distress. That makes it both a more resilient business and a less straightforward economic thermometer.
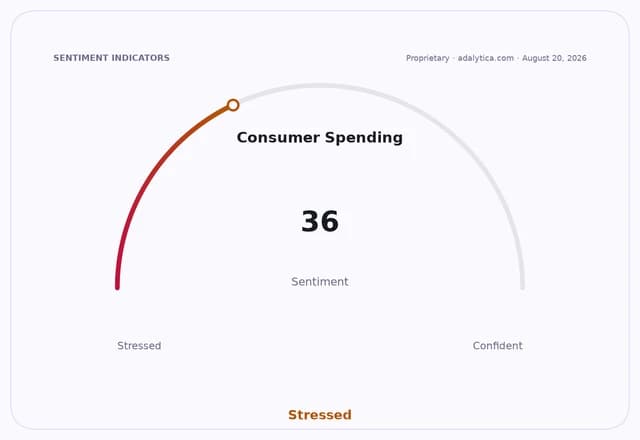
Adalytica’s Consumer Spending Sentiment gauge is neutral at 36, underscoring the ambiguity in the current backdrop. The macro picture is not one of collapse so much as uneven behavior: households remain selective, but they are still spending where the value proposition is clear. That favors operators with pricing power, strong private-label economics and loyal members.
For investors, the implication is that Walmart weakness should not be overread as evidence of a broad consumer break without corroboration from other channels. Costco’s relative strength suggests the better trade may be the businesses that can defend baskets, preserve margins and keep members renewing, even if the consumer is getting more cautious.
The next test will be whether that divergence widens through the back half of the year. If Costco continues to outpace while Walmart struggles to convert traffic into profit, the market may decide that the right consumer signal is no longer found at the biggest discounter, but at the best-run one.
| Entity | Gains | Losses |
|---|---|---|
| Costco | ▲Share gains, defensive demand | ▼From valuation if growth slows |
| Walmart | ▲Traffic from budget shoppers | ▼Margin pressure, weaker read-through |
| Regional grocers | ▲Convenience and quality trade-up | ▼Price-sensitive traffic |
| Aldi | ▲Extreme-value shoppers | ▼Higher-income bulk buyers |