OPEC Raises 2026 U.S. Oil Output Forecast
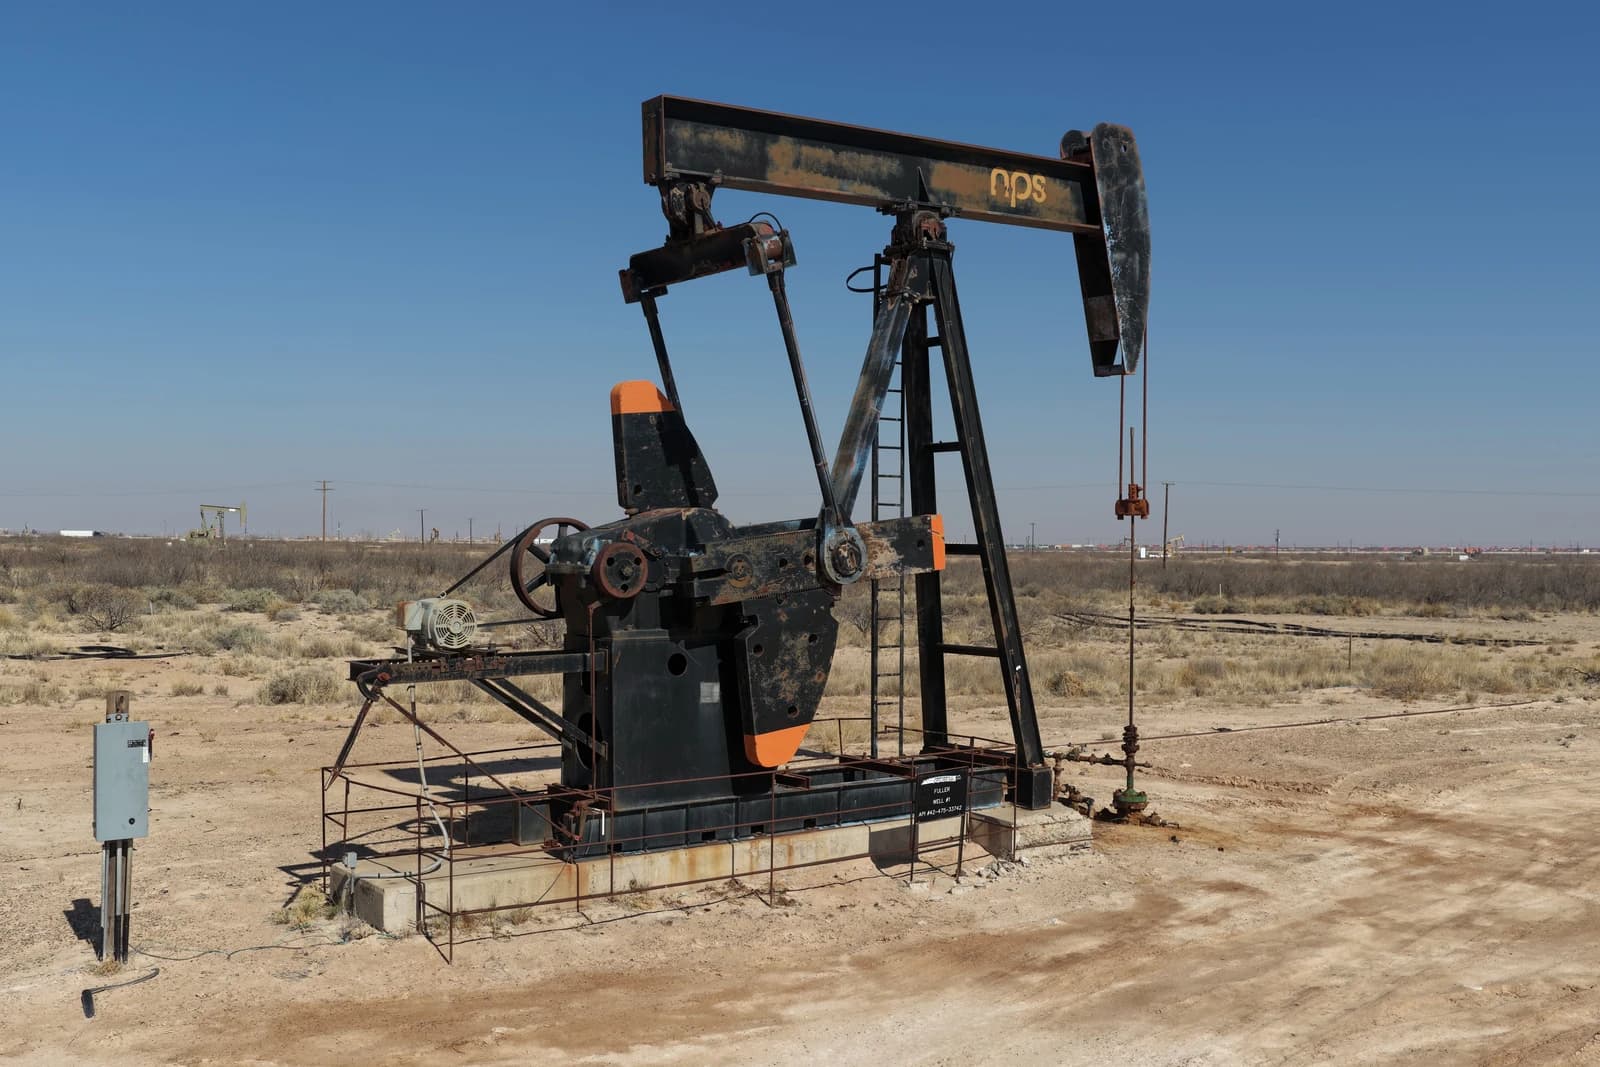
OPEC’s decision to raise its 2026 forecast for U.S. crude and condensate production to growth of just 90,000 barrels a day underscores a slower-expanding supply outlook for the world’s biggest oil producer — a shift that matters for prices, producer margins and how much slack the market will have next year.
For investors, the upgrade is less about a dramatic surge in U.S. output than about the implications of a still-growing supply base at a time when oil has already been volatile and heavily driven by geopolitical risk, OPEC policy and macro demand concerns. A smaller increase in U.S. barrels than in prior years suggests American shale is maturing into a more capital-disciplined business, but it also leaves global balances more sensitive to any disruption in supply or demand.

The backdrop is a market that has remained structurally tight enough to keep energy shares supported. XLE, the energy-select sector ETF, closed at $65.14 on Sept. 11, well above its 50-day moving average of $60.14 and its 200-day moving average of $54.80, while U.S. Oil Fund, or USO, finished at $154.90, still near the top of its recent range after a sharp run-up this year. The broader rally in energy has been reinforced by crude’s ability to recover from earlier weakness, with WTI last forecast at $97.336 a barrel, up modestly day on day.
That makes OPEC’s revised U.S. outlook important not because 90,000 barrels a day is large — it is not — but because it points to a slower pace of non-OPEC supply growth that can help keep the market balanced. If U.S. output is no longer rising at the breakneck pace seen in past shale booms, OPEC and its allies need to supply less to defend prices, and oil bulls get a more supportive backdrop.
The update also has direct implications for the equity market’s energy leaders. Integrated producers and shale-heavy names have benefited from expectations that supply discipline can coexist with healthy prices. Oil-services stocks have been even more sensitive: Halliburton, Schlumberger and other contractors gain when drilling and completion activity stays firm, but they lose if the industry turns more cautious or if pricing weakens. OIH, the oil-services ETF, closed at $420.67, far above its 200-day moving average of $380.50, reflecting a sector still pricing in a constructive spending cycle.
There is a limit, though, to how bullish the message can be. OPEC’s own revised view still assumes U.S. production grows, just less rapidly, which means the market cannot count on a supply shortage by default. Chevron said in its latest filing that net oil-equivalent production rose 23% in the quarter, helped by Hess and Permian growth, while ConocoPhillips warned that future production remains exposed to volatile prices and capital-allocation choices. That tension — between resilient large-cap output and a slower overall growth profile — is what investors need to watch.
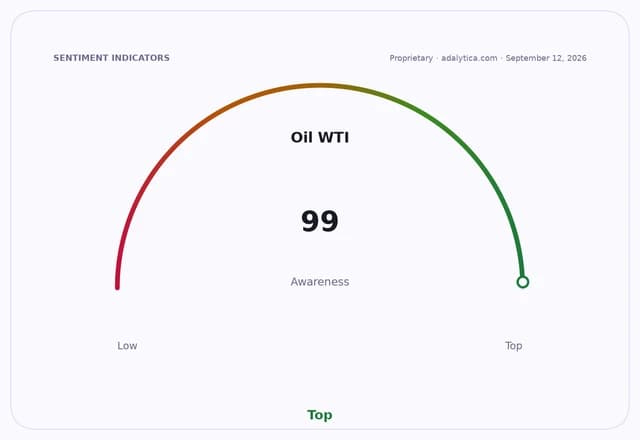
The economic significance is straightforward: slower U.S. supply growth tends to support crude prices, lift cash flows for producers and keep the services cycle healthier for longer. The bear case is that if demand softens or prices stay high for too long, the market could quickly flip into volatility again, especially with sentiment in oil already showing extreme fear in Adalytica’s trade signals even as awareness remains elevated.
For now, OPEC’s forecast upgrade suggests the supply side of the oil market is becoming less explosive and more manageable. That is a constructive setup for producers and energy equities, but it also means every geopolitical shock, refinery outage or macro surprise carries more price-setting power than it did when U.S. shale growth was running much hotter.
| Entity | Gains | Losses |
|---|---|---|
| OPEC+ | ▲Better price support | ▼Less need for deep cuts |
| U.S. producers | ▲Stronger cash flow outlook | ▼Slower volume growth |
| Energy equities | ▲Higher earnings visibility | ▼Risk of price pullbacks |
| Refiners and consumers | ▲Lower supply volatility | ▼Higher feedstock costs |