S&P 500 Nears 7,843 After Six-Year Rally

The S&P 500 is on track to rise to 7,843 on Thursday, capping a roughly 200% gain for investors who held cash through a six-year run that has been powered by lower rates, resilient growth and repeated advances in Big Tech.
That is the central market story behind the numbers: the broad US equity benchmark has more than tripled from 2,180.89 in August 2016 to a forecast 7,843.176, even after bouts of severe volatility in 2020, 2022 and earlier this year. For a long-term holder without leverage, the move translates into one of the strongest wealth-creation periods in modern market history, and it explains why dip-buying has remained such a durable feature of US equities.
The advance has not been linear. The index was knocked down during the pandemic shock in March 2020, then again in 2022 when higher inflation and surging Treasury yields pressured valuations, and briefly this spring when tariff fears and growth concerns triggered another pullback. But each drawdown has been followed by a faster recovery, leaving the S&P 500 at 7,723.55 on Wednesday and within reach of another record.
The bond market backdrop underscores why equities have been able to absorb repeated shocks. The 10-year Treasury yield, which had climbed to 4.75% on July 31, has eased to a forecast 4.668% for Wednesday after touching 4.63% on Tuesday. A modest retreat in yields improves the present value of future earnings and helps justify richer valuations, especially for long-duration growth stocks that dominate the S&P 500 and Nasdaq-100.
The Nasdaq-100 has mirrored that leadership. QQQ closed at 717.3 on Wednesday, up sharply from 587.35 last October and supported by the same large-cap technology complex that has kept index-level returns ahead of the broader economy. The Russell 2000, meanwhile, has lagged the mega-cap complex despite a strong rebound to 299.77, reflecting how investors have continued to favor balance-sheet strength, pricing power and exposure to AI-related capital spending over smaller, more rate-sensitive companies.
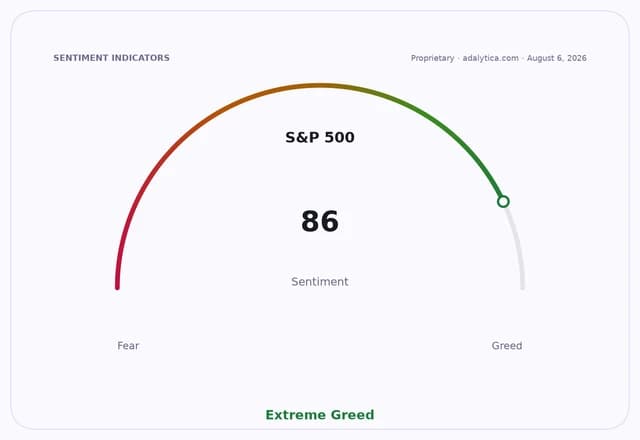
Technical readings suggest the rally remains intact even as it looks stretched. SPY sits above its 50-day and 200-day moving averages, while RSI readings in the low-60s point to strength without yet flashing the kind of extreme overbought condition seen earlier in the year. Adalytica’s S&P 500 trade signals show sentiment at 86, labeled Extreme Greed, with awareness at 100, a sign that positioning has become more crowded even as momentum persists.
For investors, the significance is twofold. Bulls can point to sustained earnings power, still-firm demand for artificial-intelligence infrastructure and a Treasury market that is no longer pushing discount rates higher. Bears will argue the opposite: that the market has already priced in a lot of good news, leaving little margin for error if growth slows, yields re-accelerate or the dollar’s renewed strength tightens financial conditions.
The next test is whether this rally can keep broadening beyond a narrow group of winners. If earnings season and macro data confirm that profits are still expanding while rates stay contained, the S&P 500’s march toward 7,843 may prove less like a climax than a waypoint. If not, the market’s strong six-year record could start to look more vulnerable to valuation compression than investors have been willing to admit.
| Entity | Gains | Losses |
|---|---|---|
| S&P 500 longs | ▲Mark-to-market wealth | ▼Bearish duration bets |
| Mega-cap tech | ▲Index leadership | ▼Rate-sensitive sectors |
| Treasury bond bears | ▲Higher equity valuations | ▼Falling yields |
| Small caps | ▲Catch-up trade potential | ▼Relative underperformance |