UNG and Natural Gas Stay Below Key Averages
European natural gas prices are under pressure again, and the message for investors is simple: the market is still trading like supply is winning over fear. That matters because gas remains one of Europe’s most economically sensitive commodities, shaping utility margins, industrial energy costs and the broader inflation outlook — and the latest tape suggests the rally that briefly excited traders has not yet turned into a durable bull market.
The U.S.-listed United States Natural Gas Fund, which investors often use as a proxy for global gas sentiment, closed at $10.15 on Sept. 11, barely above its recent $10.09 low and still below its 200-day moving average of $11.64. The fund has spent much of the past year trapped in violent swings, but the current setup is less about momentum and more about compression: UNG is pinned near its lower trading band, while the 50-day average at $10.35 has turned into immediate resistance. That is not a bullish chart if you are looking for an easy trade.
The underlying front-month natural gas contract is telling a similar story. NG=F ended at $2.83, almost unchanged from the prior session and well below the peaks that sparked earlier speculative bursts. The contract’s 50-day average sits at $2.86, with the 200-day at $3.27, a reminder that the broader trend remains soft even after periodic spikes. Technical readings are no longer oversold, but they are not signaling a breakout either. In other words, this is a market that has already absorbed a lot of volatility without proving it can hold a higher range.
That matters economically because Europe’s gas market is still the cleanest barometer of winter risk, storage comfort and the continent’s exposure to geopolitical shocks. When prices fail to sustain rallies, it usually means traders see enough supply flexibility — from LNG flows, storage buffers or demand destruction — to offset panic bids. For households and energy-intensive industries, that is a relief. For power generators and gas producers, it is a warning that pricing power may not arrive as quickly as hoped.
The broader energy complex is reinforcing the same message. The Energy Select Sector SPDR Fund, XLE, has climbed to $65.07 from $57.5 in early August, showing that oil-linked equities are still attracting capital even as gas remains subdued. That split is important: investors are preferring hydrocarbons with tighter supply discipline and stronger cash returns, rather than chasing a gas market that keeps fading after every spike. The trade is increasingly about selectivity, not blanket bullishness.
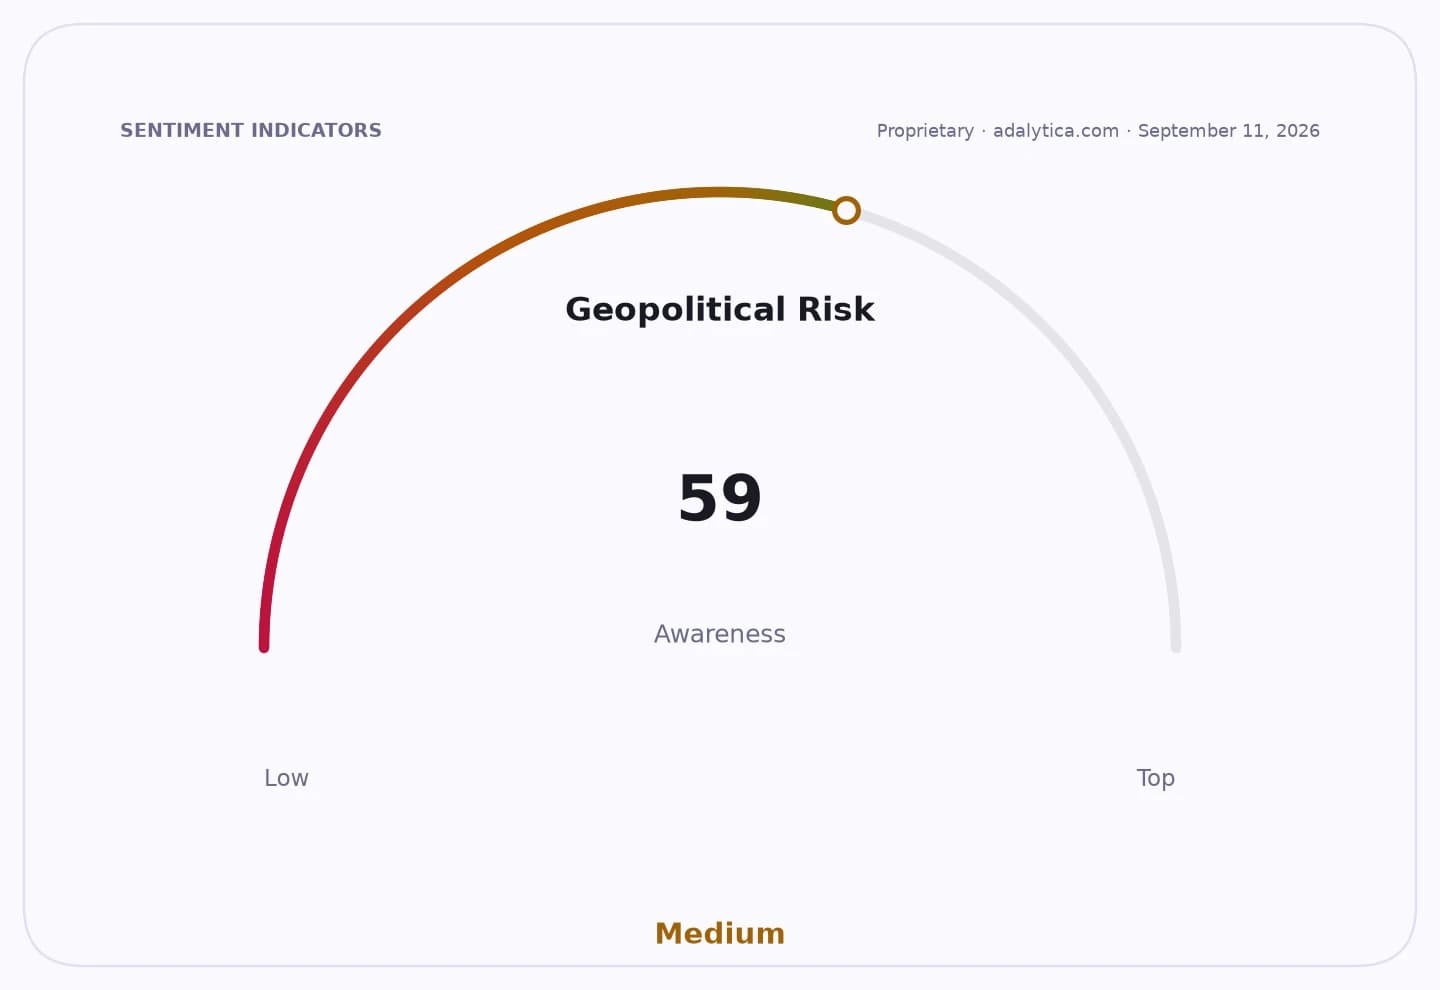
There is also a geopolitical angle. Adalytica’s Global Stability Sentiment remains in “Fear,” but the latest reading has not translated into a sustained gas bid. That suggests the market is no longer reacting to geopolitical risk with the same urgency unless supply is directly threatened. For investors, that reduces the odds of a persistent squeeze and raises the bar for any upside catalyst.
My view is that European gas is still a tactical, not strategic, long. If you want exposure, the better trade is to wait for a true supply shock or a decisive move back above the 200-day averages in both UNG and the front-month contract. Until then, the market is telling you that the path of least resistance is sideways to lower, and the smarter money is staying nimble rather than married to the thesis.
| Entity | Gains | Losses |
|---|---|---|
| Industrial gas users | ▲Lower input costs | ▼Less relief from volatility |
| European utilities | ▲Cheaper fuel hedge costs | ▼Margin upside fades |
| LNG exporters | ▲Stable export demand | ▼Weaker spot pricing |
| Gas bulls | ▲Short-covering spikes | ▼Lack of sustained trend |