Ethereum is holding the low-$2,200s for now, but the rebound is losing force as spot price slips back toward support and derivatives remain balanced rather than decisively bullish.
Ethereum Holds $2,200 Support as Momentum Fades

ETH last changed hands at $2,235.01 on Binance, down 0.51% on the day and still trapped inside a narrow $2,223 to $2,252 range after a recovery attempt stalled. That leaves the token just above an immediate support cluster at $2,221.59 and strong support at $2,208.18, with the pivot point almost exactly at the current price.
Sentiment Indicators

The bigger market issue is that ETH has not escaped the band that has capped it for days. Prior attempts to push toward $2,450 have failed, and the latest bounce still looks more like a pause in a downtrend than the start of a sustained reversal.
Technicals back that up. Ethereum is still below its 7-day and 20-day simple moving averages, as well as its 12-day and 26-day exponential moving averages, and remains well under the 50-day moving average at $2,485.29. The 200-day moving average at $2,156.54 is now acting as a lower anchor, underscoring a market that has stabilized but not repaired.
Ethereum
Momentum remains weak. The daily RSI at 39.26 sits below the midpoint, while MACD is negative and flat, suggesting momentum has cooled but not turned decisively higher. ETH is also sitting in the lower portion of its Bollinger Band structure, with the lower band at $2,166.71 and the upper band at $2,469.01.
Derivatives are not giving bulls a strong confirmation either. Binance Futures funding is neutral at 0.0046%, open interest stands at 2.37 million contracts, and taker flow is nearly balanced at 1.0097. Long positioning is still heavy — with 77.8% of accounts net long — but the order flow does not show aggressive conviction, which leaves the market vulnerable if spot demand fades.
That matters for investors because Ethereum is still trading like an asset waiting for a catalyst, not one already in a trend. If ETH can reclaim the $2,250 to $2,265 resistance zone and then push back above its short-term averages, traders may start to treat the move as a genuine base. If $2,221 fails, the next tests are $2,208 and then the 200-day moving average.
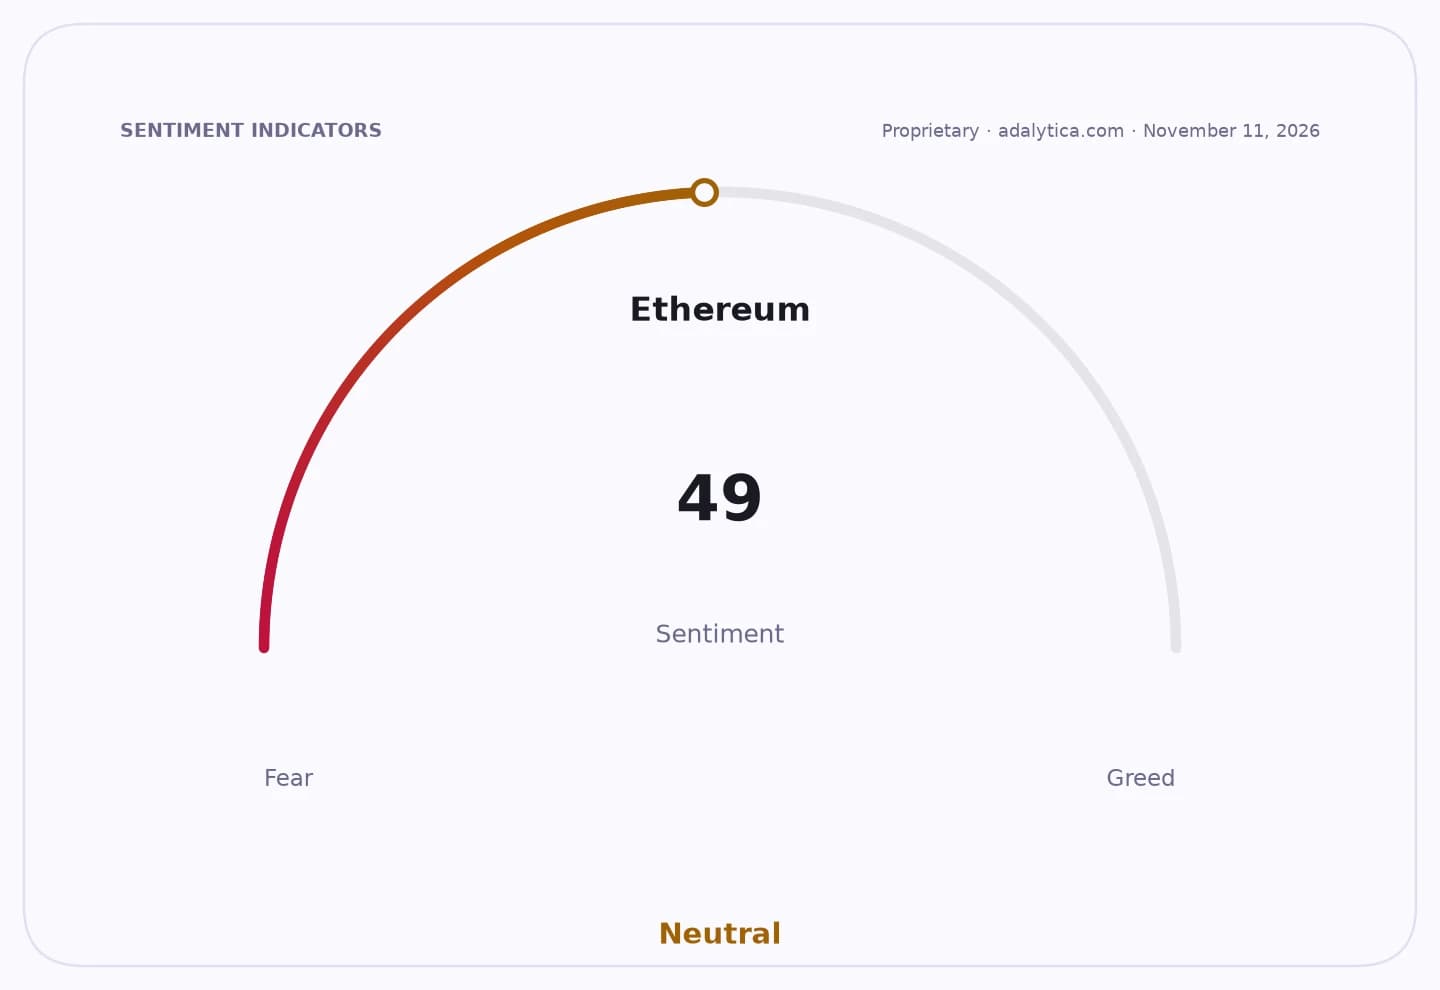
There is at least one sign that demand is not gone: TradingView reported that US spot Ethereum ETFs drew $53.04 million of net inflows on Nov. 4, breaking a seven-session outflow streak. But the price action has not yet confirmed that demand, and sentiment remains brutally weak, with Adalytica’s Ethereum Fear & Greed Index at 11, or extreme fear.
| Entity | Gains | Losses |
|---|---|---|
| ETH bulls | ▲Hold $2,200 support | ▼Need fresh demand to break resistance |
| ETH bears | ▲Benefit from weak momentum | ▼Risk squeeze if support holds |
| Spot ETF buyers | ▲Improve entry if inflows persist | ▼See no immediate price follow-through |
| Leveraged longs | ▲Maintain positioning | ▼Face downside if $2,221 breaks |