Bitcoin’s latest slide to about $74,346 has put the world’s largest cryptocurrency on the defensive, but the bigger story is not a full trend break — it is a test of whether buyers can defend a key long-term support zone around the 200-day moving average.
Bitcoin tests $73,000 support near 200-day average
Bitcoin
That matters because Bitcoin is now trading below its 7-day, 20-day and 50-day moving averages, a clear sign that short- and medium-term momentum has rolled over. At the same time, spot is sitting close to the 200-day average near $73,204, with the lower Bollinger Band at $73,517 also acting as a near-term floor. In other words, Bitcoin is not in free fall yet, but it is pressing against the kind of technical level that often decides whether a correction becomes something more serious.
Sentiment Indicators
For investors, this is exactly the sort of setup that rewards patience and punishes panic. Bitcoin’s daily RSI at 34.42 shows weakness, but not the kind of washed-out reading that usually marks a decisive bottom. The MACD histogram is flat, which suggests momentum has stalled rather than collapsed. That leaves the market in a fragile middle ground: vulnerable to another leg lower, but also capable of stabilizing if spot can hold the low-$73,000s.
Derivatives positioning adds an important wrinkle. On Binance Futures, open interest stands at $7.28 billion, up 1.86% over 24 hours even as price softened. That tells you leverage has not been fully flushed out. Long positioning still dominates, with the global long/short ratio at 2.83 and top-trader accounts at 3.12, while taker flow is only slightly negative at 0.91. So this is not a market in panic mode — it is a market that still has optimism embedded in it, which can be helpful if support holds and dangerous if it does not.
That combination makes the next move crucial. Immediate support sits at $73,170, with stronger support near $71,995. Resistance begins around $75,861 and extends toward $77,375. If Bitcoin can reclaim the mid-$75,000s, it would suggest the recent selloff was a shakeout rather than the start of a larger downtrend. If it loses the low-$73,000s decisively, the market could quickly test the stronger support band and force a more painful unwinding of long positions.
For long-term investors, the message is straightforward: Bitcoin remains a volatile asset, but volatility is not the same thing as a broken thesis. The longer-horizon trend is still intact as long as the 200-day area holds. That is why corrections like this often matter more as opportunity than as danger — provided you are sizing positions sensibly and thinking in years, not days.
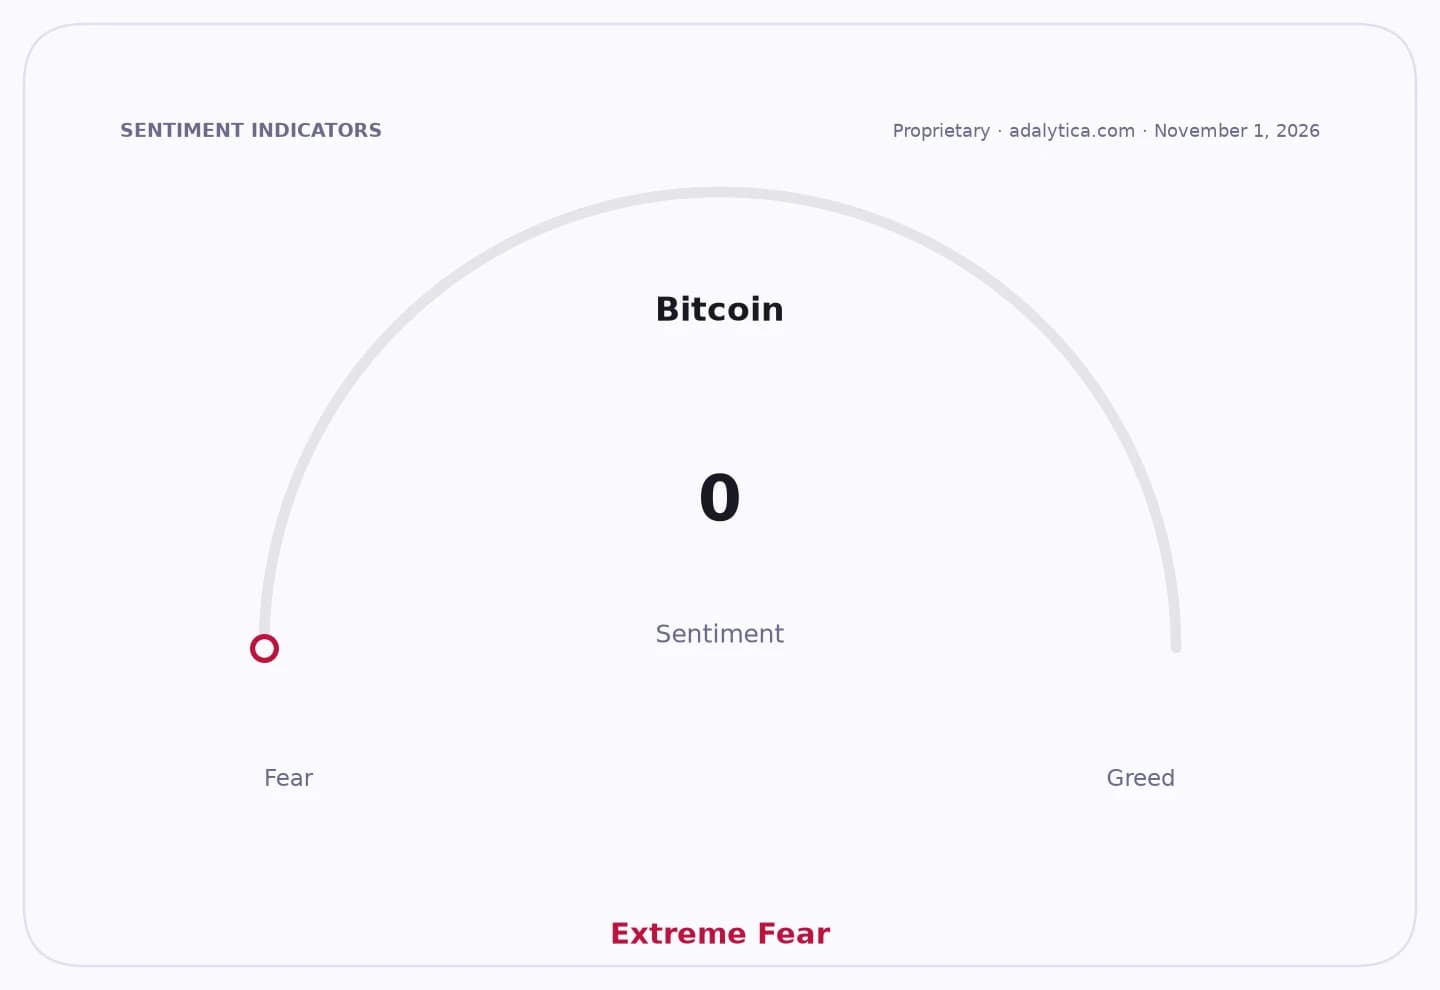
Adalytica’s Bitcoin Fear & Greed snapshot also points to a market that is uneasy but not euphoric, with sentiment at 33 and labeled neutral. That supports the idea that this is a corrective phase, not a crowded mania unwinding. In a world where risk appetite can turn quickly, Bitcoin’s ability to hold its long-term support could be the difference between a routine reset and a deeper repricing.
For now, investors should treat Bitcoin as a watchlist name, not a panic sale. The long-term story is still there, but the short-term message is simple: BTC needs to prove that support near $73,000 can hold before the bulls regain control.
| Entity | Gains | Losses |
|---|---|---|
| Long-term Bitcoin holders | ▲Potential buy-the-dip setup | ▼Short-term mark-to-market pain |
| Bitcoin bears / short sellers | ▲Near-term downside momentum | ▼Risk of support-driven rebound |
| Leveraged long traders | ▲Possible rebound if support holds | ▼Forced unwind if $73,000 breaks |
| Patient investors | ▲Better entry prices over time | ▼Less certainty in the near term |