Grab is retaining just 14.95% of gross ride value in its core mobility business, a metric that matters because it shows how much of each trip the platform actually keeps after paying incentives and promotions.
Grab Q2 ride take rate falls as incentives rise
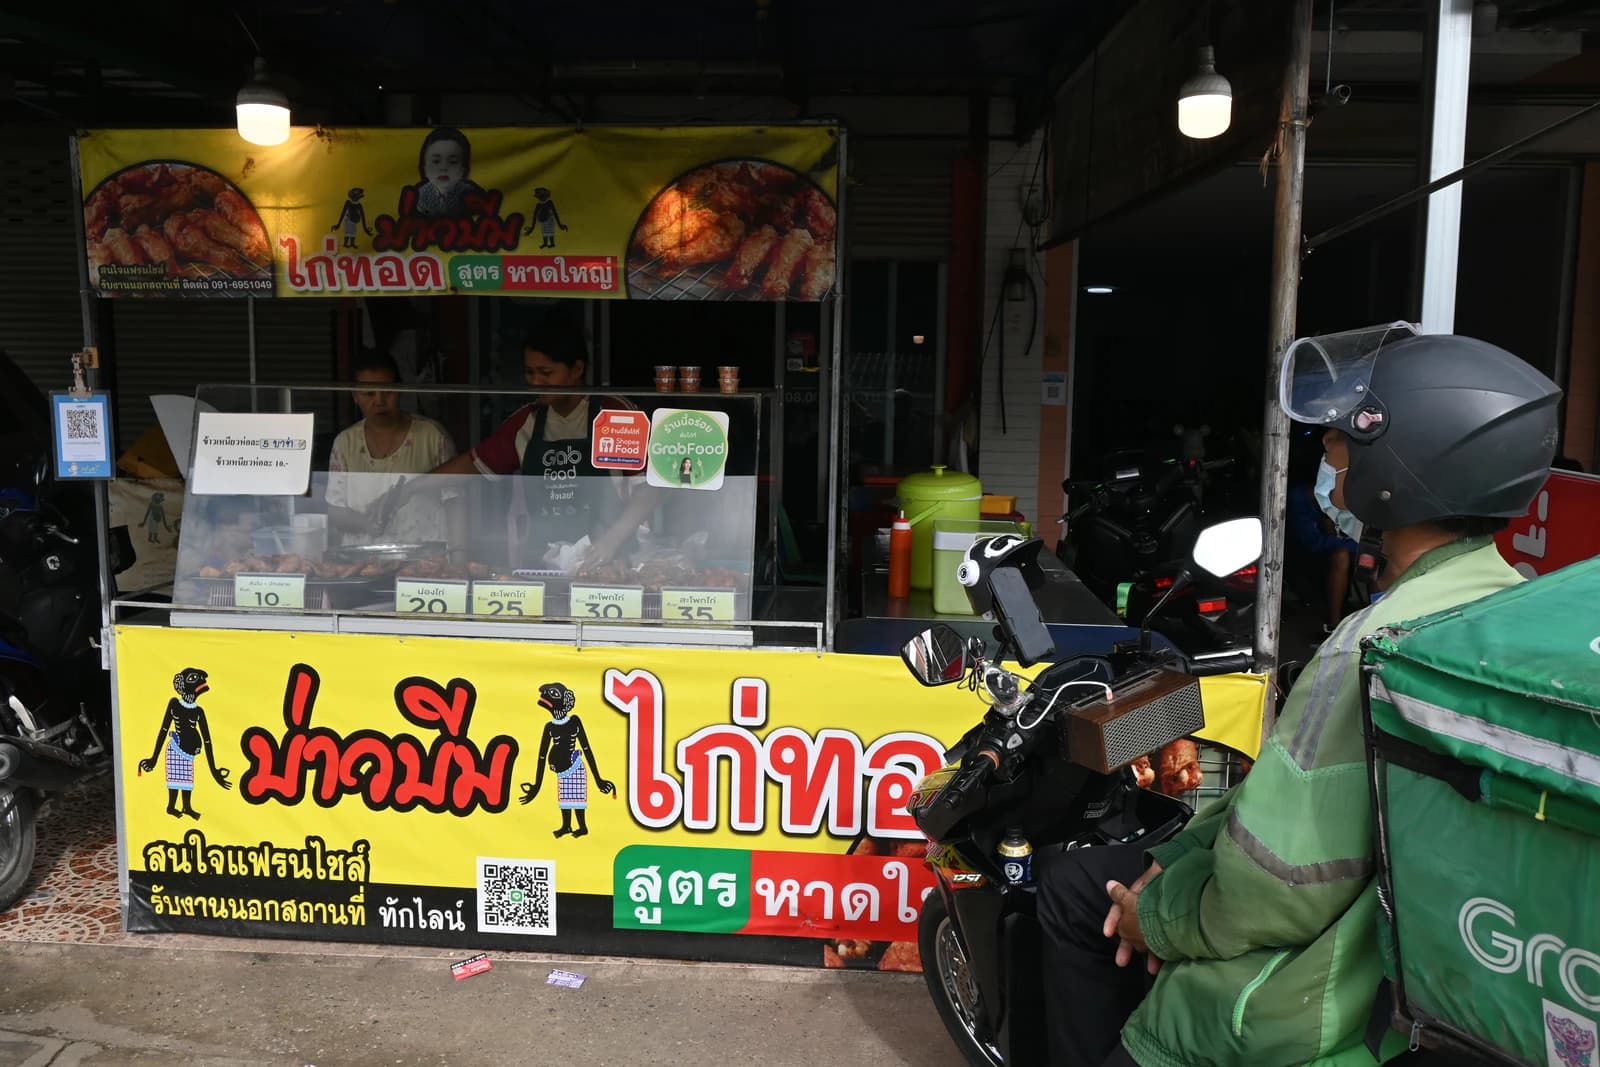
That take rate slipped from 15.67% a year earlier even as ride gross merchandise value rose 18% to $2.214 billion and revenue climbed 12% to $331 million in the second quarter, underscoring the trade-off Grab is making between monetization and growth. For investors, the key question is whether higher subsidies for drivers and users can keep trip volumes rising fast enough to offset thinner margins.
Grab’s on-demand business is being propped up by heavy promotional spending. Total incentive costs reached $706 million in the quarter, including $317 million for driver rewards and $389 million for consumer discounts, lifting on-demand promotions to 10.9% of GMV, up 72 basis points from a year earlier.
The strategy appears to be working on activity. Monthly active drivers rose 19% to a record, aided by more than $7 million in fuel support, while mobility transactions jumped 28% and monthly transacting users hit a record 53.9 million.
That volume growth helped offset the lower take rate and support profitability. Mobility still generated $191 million of EBITDA, more than 70% of Grab’s total, while group adjusted EBITDA rose 54% to $168 million and operating profit improved to $19 million.
Delivery remains the larger revenue engine, with GMV of $4.249 billion and revenue of $531 million, equal to a roughly 12.5% take rate, but its margin profile is also improving. Adjusted EBITDA margin on delivery GMV rose to 2.3% from 1.8%, helped by a 21% increase in active advertisers and higher merchant spending on GrabAds.
The takeaway for investors is that Grab is buying scale in a high-rate, fuel-sensitive environment, and the market will keep weighing that against the company’s ability to convert volume into durable margins. The next catalysts are whether the incentive burn moderates, whether ad revenue keeps scaling and how quickly management can sustain growth without further pressuring take rates.
| Entity | Gains | Losses |
|---|---|---|
| Grab | ▲Higher trip volume | ▼Lower take rate |
| Drivers | ▲More incentives and fuel support | ▼Pressure on earnings mix |
| Consumers | ▲More promotions and cheaper rides | ▼Less margin cushion |
| Investors | ▲EBITDA growth potential | ▼Promotion-driven monetization risk |