Bitcoin is sliding even as U.S. spot bitcoin ETFs took in $526.6 million in a single day, a reminder that the cryptocurrency is still trading more like a high-beta risk asset than a pure flow story.
Bitcoin Falls Despite $526.6M ETF Inflows
That matters because investors have spent much of this cycle treating ETF demand as the cleanest bullish narrative for bitcoin. But when the biggest daily inflow in about a month comes alongside a drop toward $79,654, the market is saying something different: macro fear is overpowering fresh demand. In other words, money is still coming in, but it is not broad enough — or strong enough — to offset the force of a global de-risking.
The flow picture helps explain why. BlackRock’s IBIT absorbed $665 million on its own, while Fidelity and Grayscale saw outflows. That is not the kind of synchronized institutional buying that usually builds a durable rally. It is concentrated demand, not a full-blown wave of conviction. For long-term investors, that distinction matters. A market can rise on narrow leadership for a while, but it becomes fragile when the bid depends too heavily on one fund and one channel.
What is pushing bitcoin lower is the broader market backdrop. Asian equities have been rattled by renewed anxiety over the durability of artificial intelligence spending, with South Korea’s Kospi falling 3.73% to its lowest level since April. Brent crude pushing above $110 is adding to inflation pressure, which in turn keeps rate-cut hopes in check. And with the U.S. 10-year Treasury yield near 5.13%, the opportunity cost of holding non-yielding assets like bitcoin is rising. When oil, rates and equity volatility all move in the wrong direction at once, speculative assets tend to lose their bid first.
Derivatives traders are preparing for more downside. On Deribit, put options outnumber calls by roughly two to one, with heavy positioning around the Oct. 30 expiry and the $80,000 strike. That does not necessarily mean panic, but it does show hedging demand is elevated. At the same time, liquidations have eased, suggesting this is more a cautious reset than a forced washout. That usually leaves the market vulnerable to another leg lower if macro conditions worsen, but it also means sellers may already be more selective than they were during a full liquidation event.
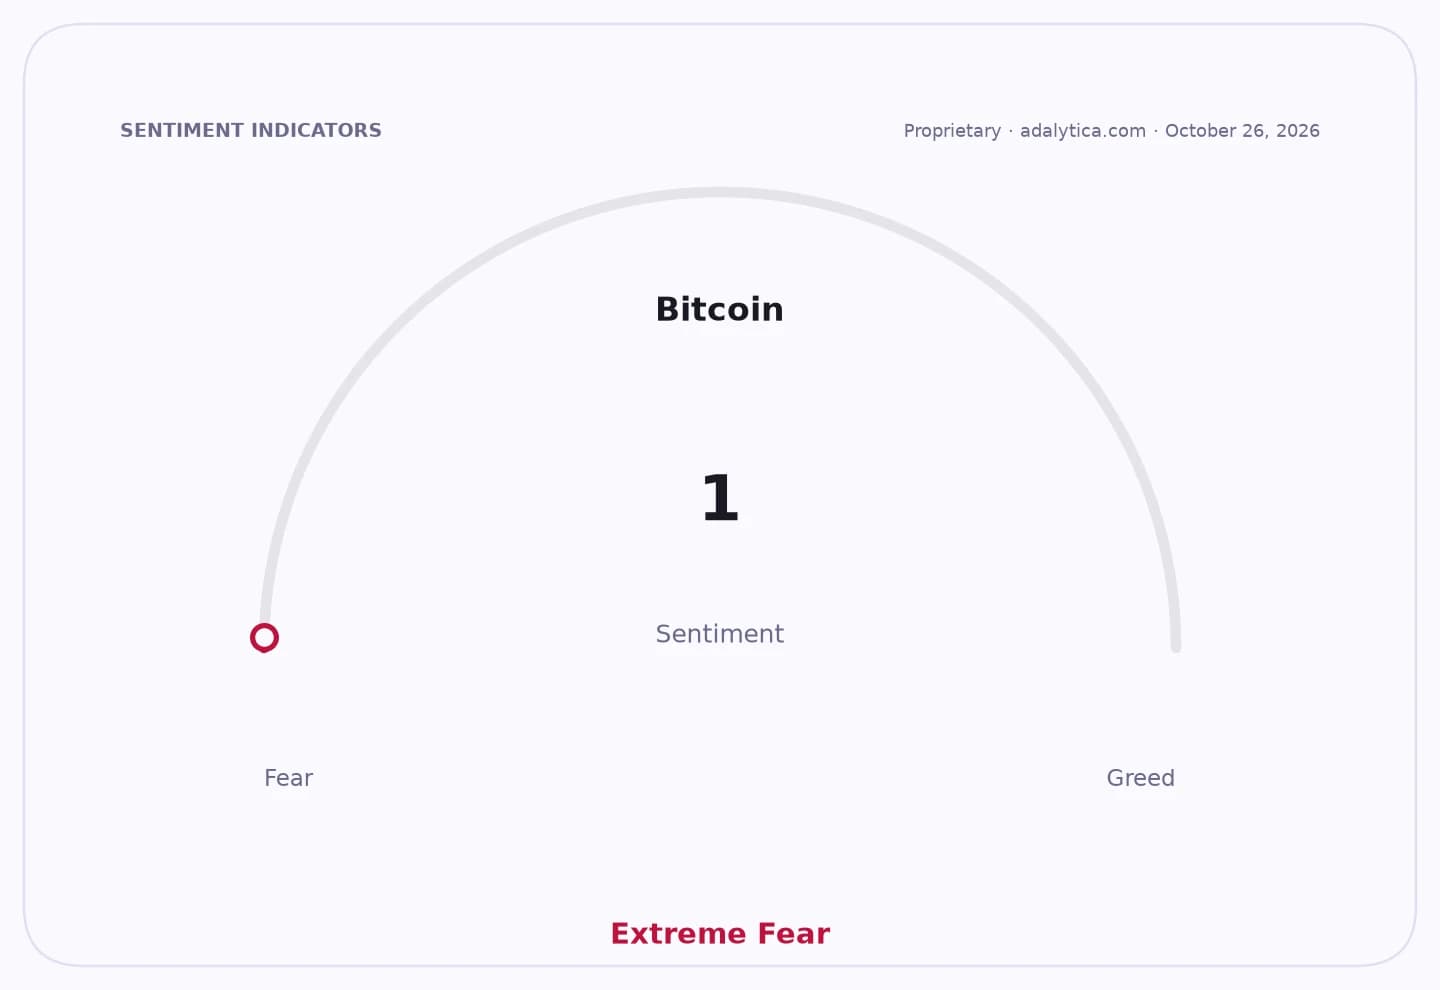
The chart reinforces the caution. Bitcoin had trouble reclaiming $83,000 and is now trying to hold the $81,300-$81,500 area, with $80,000 acting as the key line in the sand. The 50-day moving average sits just above $81,797, while the price has slipped to the lower edge of the Bollinger Band range, a sign that momentum has weakened. Adalytica’s Bitcoin Fear & Greed Index shows “Extreme Fear,” with sentiment near 1, underscoring how quickly conviction has evaporated.
For investors, the larger lesson is that bitcoin still lives at the intersection of liquidity, rates and risk appetite. ETF adoption has improved the asset’s access and legitimacy, but it has not insulated it from macro shocks. If the market stabilizes, inflows can support the next advance. If oil stays hot, bond yields stay elevated and equities keep wobbling, bitcoin may keep drifting lower even with positive fund flows. Long-term believers may still view weakness as an opportunity, but patience is the real edge here — not chasing every inflow headline.
| Entity | Gains | Losses |
|---|---|---|
| BlackRock IBIT | ▲Captures most inflows | ▼Becomes the lone buyer |
| Fidelity and Grayscale | ▲— | ▼Outflows and weaker demand |
| Bitcoin bulls | ▲Lower entry levels | ▼Momentum and near-term conviction |
| Risk assets overall | ▲— | ▼Higher rates, oil and fear pressure |