Ethereum is stuck in a technically fragile holding pattern, with the MACD histogram flat at zero and price still trading below the 20-day and 50-day moving averages, leaving bulls with little proof that the recent slide has run its course.
Ethereum Holds Below Key Averages Near $2,432
That matters because Ethereum is not just drifting lower in isolation; it is sitting below layers of short-term resistance while aggressive sellers continue to lean on the market. ETH was last changing hands near $2,432, just above its 7-day simple moving average, but still well under the 20-day average around $2,511 and the 50-day average near $2,553. In plain English, the short-term trend remains capped, and every attempt to rally back toward $2,500-2,560 is running into overhead supply.
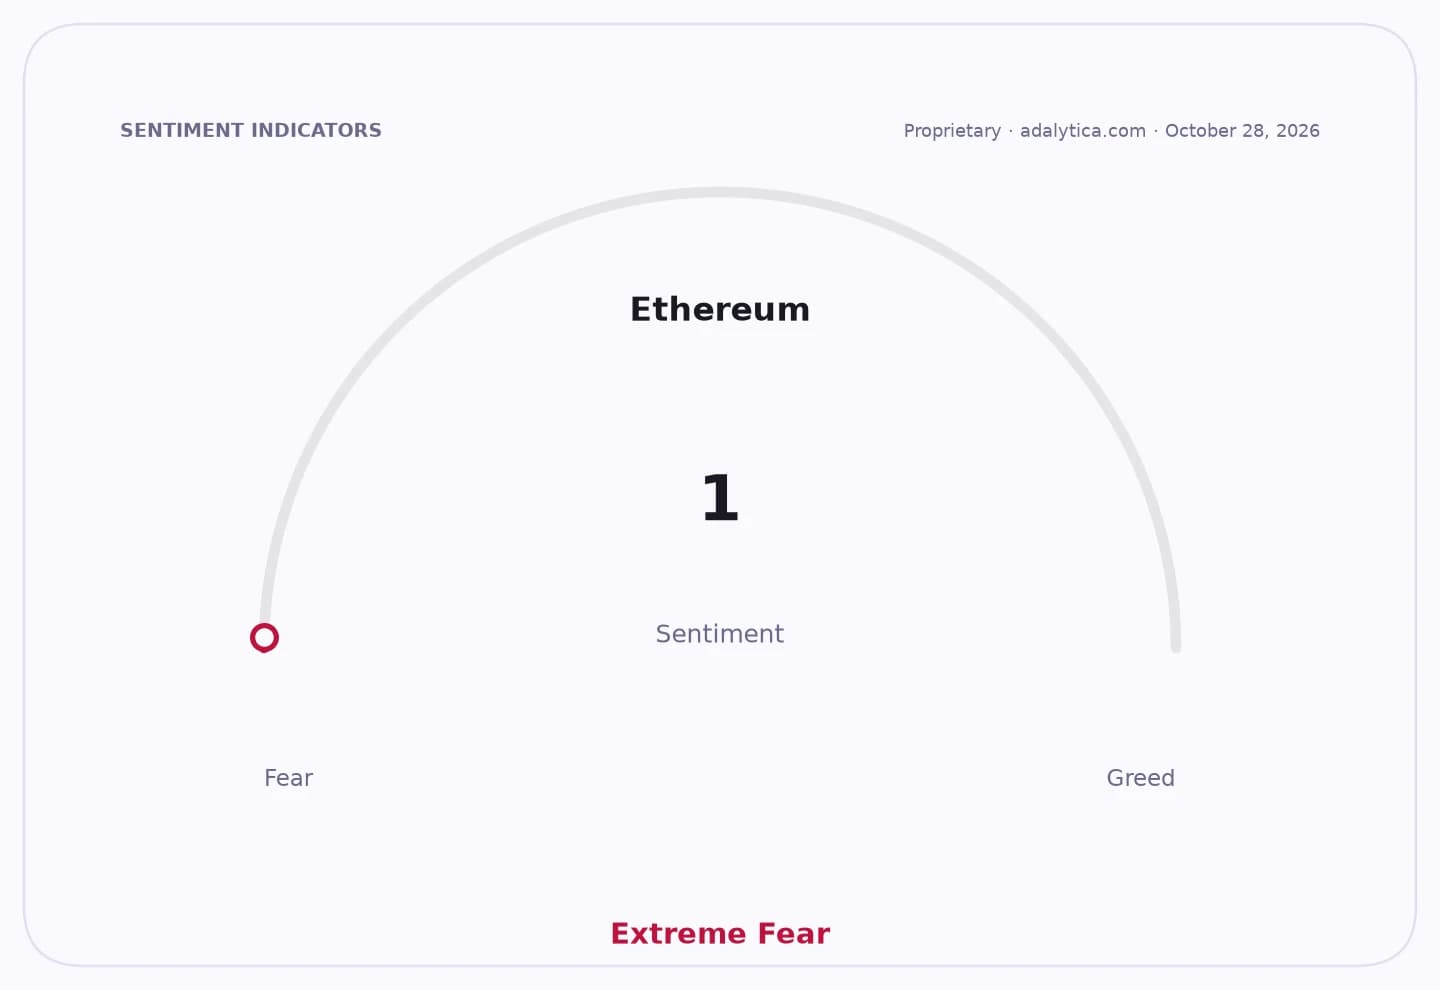
Sentiment IndicatorsⓘProprietary · adalytica.com · October 28, 2026
This is a snapshot — live sentiment, awareness and momentum for 130+ markets update continuously in the dashboard.Open AlphaPulse
The MACD picture is especially important for investors because it shows momentum has stalled, not recovered. Both the MACD line and signal line are negative and identical, which leaves the histogram at zero. That is a convergence point, not a bullish turn. The 14-day RSI around 42 also says Ethereum is not oversold enough to force a rebound, while the Bollinger setup still leaves price in the lower part of its daily range. For long-term investors, that combination usually means patience is required before a convincing trend change appears.
There is, however, a longer-term floor worth watching. Ethereum is still above its 200-day moving average near $2,156, which keeps the broader structure intact for now. But the market is not rewarding that cushion yet because near-term positioning remains cautious. Binance futures open interest has risen modestly, funding is neutral, and the sharpest short-term signal in the derivatives data is more selling than buying from aggressive traders. The taker buy/sell ratio below 1 suggests participants are more willing to hit bids than lift offers.
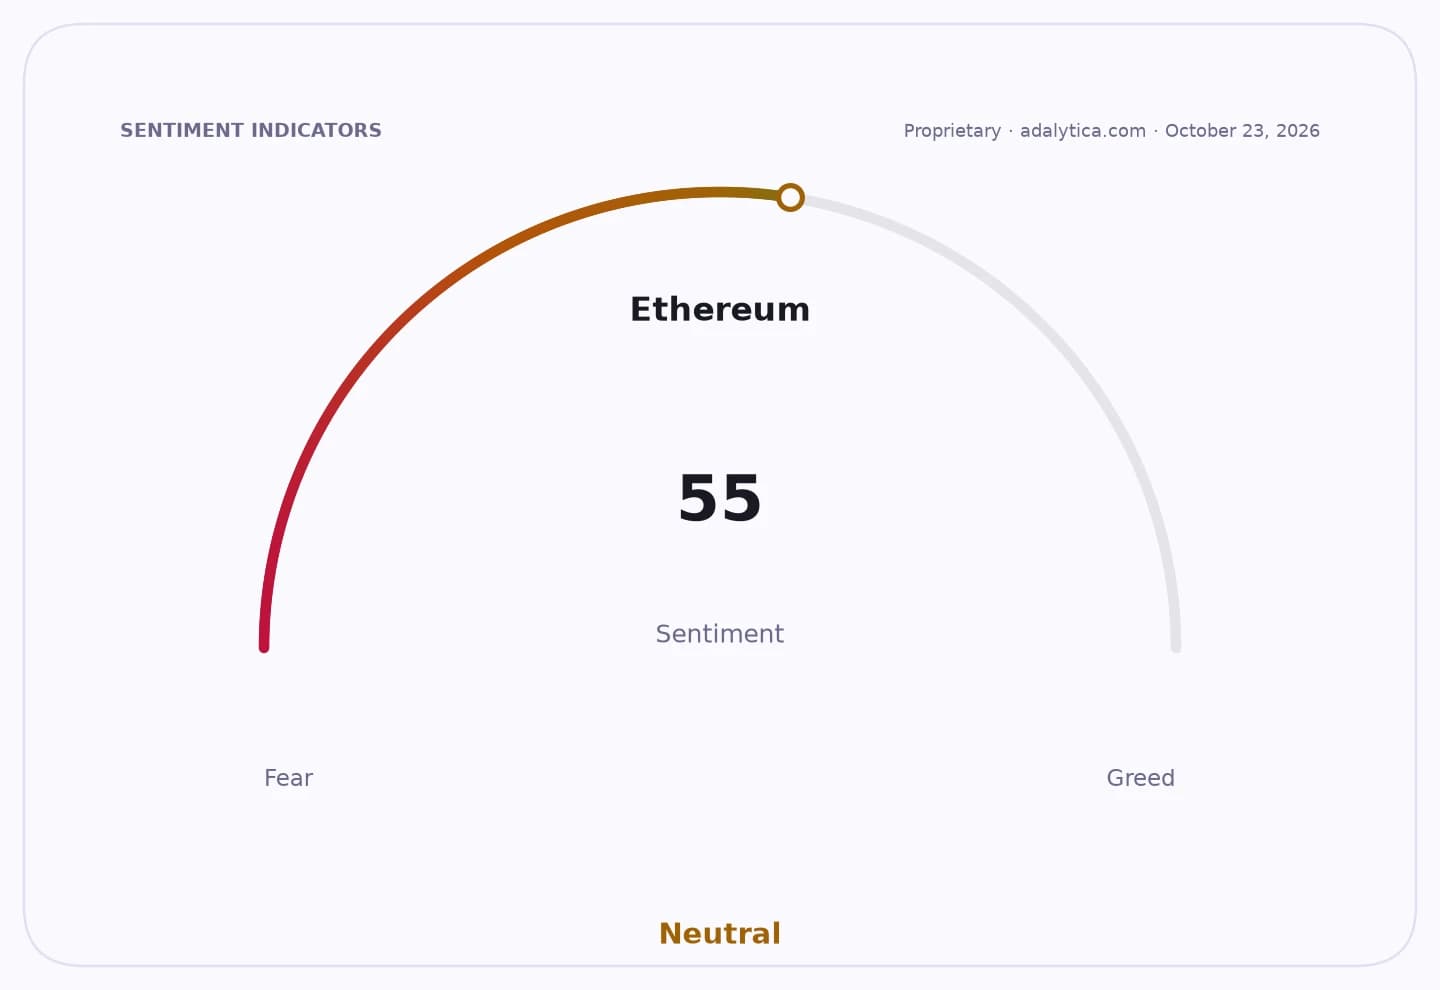
That technical weakness is occurring alongside a more sobering sentiment backdrop. Adalytica’s Ethereum Fear & Greed snapshot shows extreme fear, with sentiment and awareness both pinned at the lowest end of the scale. When fear is this deep, investors often assume a bargain is forming. Sometimes that is true. But for Ethereum, extreme fear has not yet been matched by a clean technical reversal, which is why price action matters more than emotion right now.
The fundamental story is mixed, and that is exactly why the chart matters. Ethereum still has a powerful long-term investment case built around smart contracts, tokenization, staking and broader blockchain infrastructure. But near-term uncertainty around network upgrades, uneven activity and sporadic selling from larger holders can weigh on confidence before any of those secular themes reassert themselves. In other words, the asset may still be structurally important, but the market is not ready to pay up for that story yet.
For investors, the key levels are straightforward. A move back above the 20-day and 50-day averages would be the first sign that Ethereum is regaining control of its trend. Failure to hold the immediate support band near $2,399 and then $2,366 would expose the lower end of the current range and bring the $2,300 area into view. The 200-day average remains the line that separates a choppy correction from something more serious.
The bottom line: Ethereum still looks like a high-quality long-term asset in a weak near-term tape. If you invest for years, not days, this is the kind of setup that calls for discipline, not panic — but it is also not the time to pretend momentum has turned. Keep it on the watchlist, and wait for price to prove the story.
| Entity | Gains | Losses |
|---|---|---|
| Long-term ETH holders | ▲Potential value if support holds | ▼Frustration from weak momentum |
| Short-term traders | ▲Range-trading opportunities | ▼Failed breakout attempts |
| Ethereum bulls | ▲A 200-day moving average floor | ▼Overhead resistance at key averages |
| Sellers / bears | ▲Near-term control of price action | ▼Risk of a sharp snapback if support breaks |