Crude oil’s latest jump above a cluster of important technical levels has put buyers back in control, but the rally is now running into the kind of overhead resistance that often decides whether a move keeps going or fades into a correction.
Crude Oil Rallies Above $86.60, Tests $93 Resistance

That matters for investors because oil is not just a commodity chart; it is a direct read on inflation, energy-sector cash flows and the market’s appetite for risk. When crude clears a well-watched level, it can improve the outlook for producers, service companies and energy ETFs. When it stalls at resistance, it often tells you the market still needs a stronger fundamental catalyst to justify higher prices.
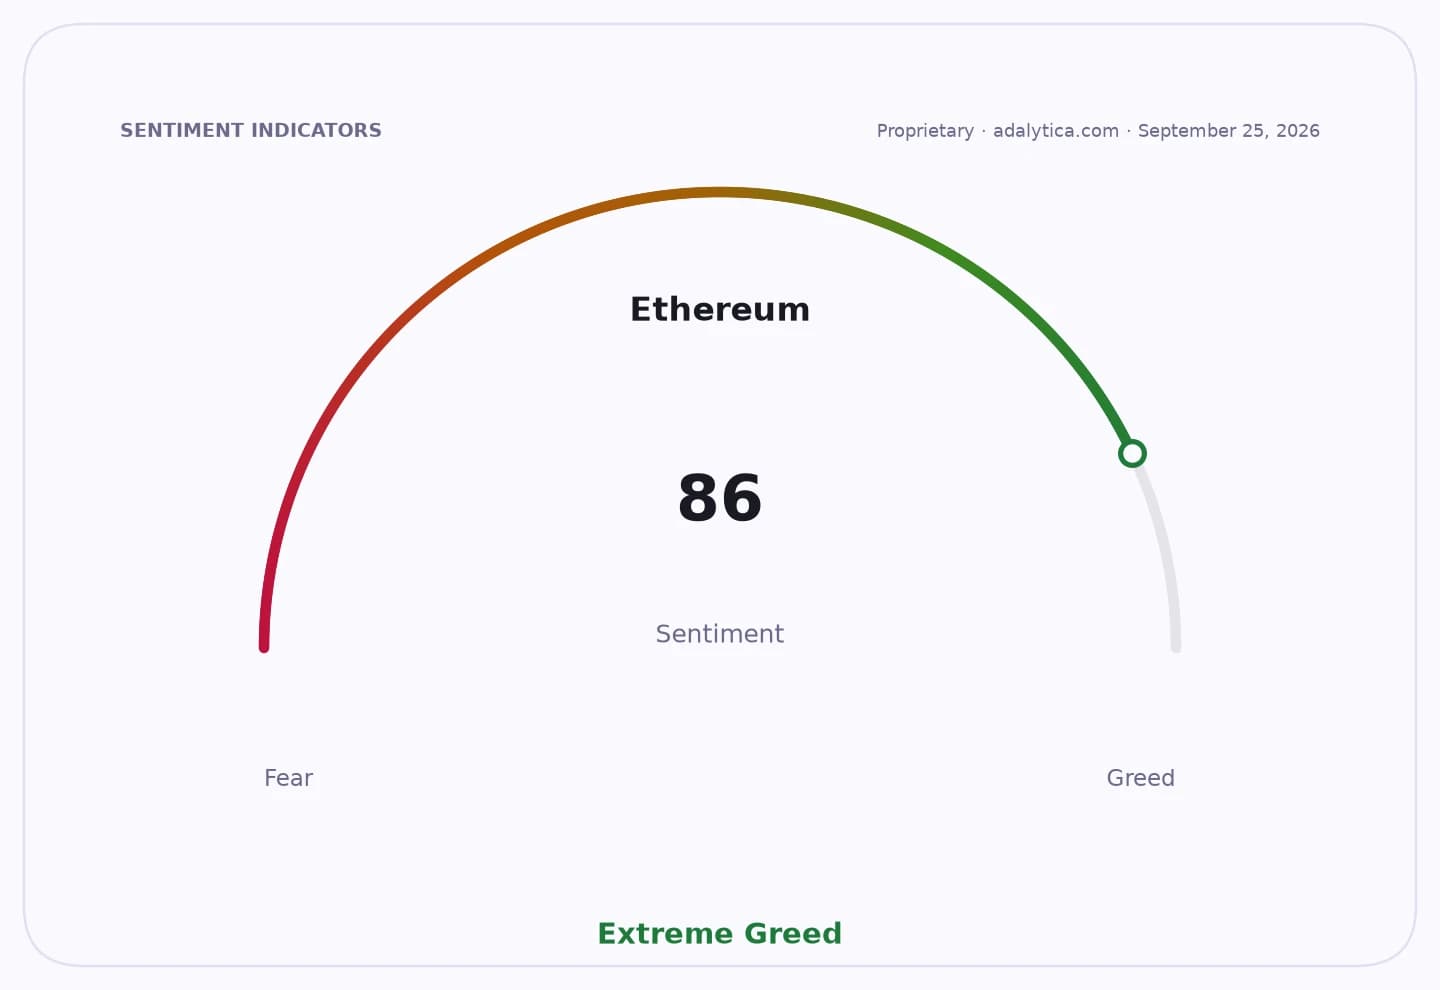
Sentiment IndicatorsⓘProprietary · adalytica.com · September 5, 2026
This is a snapshot — live sentiment, awareness and momentum for 130+ markets update continuously in the dashboard.Open AlphaPulse

The key development this week was crude’s push above about $86.60, where the 100-day moving average and the 38.2% retracement of the April-to-July decline came together. That kind of confluence matters because technical traders do not see a single line in isolation. They look for clusters, and when multiple indicators line up, they tend to treat that area as more meaningful support or resistance.
Once crude broke through that band, the next upside target became the $92.87 to $93.50 zone. That is where the 50% retracement of the April-to-July drop meets a series of swing highs from mid-June. The market’s recent high at $93.14 landed right in that pocket, which is exactly why the price has started to rotate lower. In plain English, buyers achieved the first objective, but they have not yet proven they can absorb supply at the next ceiling.
DCOILWTICO — macro contextadalytica.com
Explore this data interactively — full history, time series and cross-market comparisons.Open AlphaPulse

For short-term traders, the day-to-day pullback also offered an important clue. The decline briefly pushed below the rising 100-hour moving average near $89.62, but it stalled before reaching the 38.2% retracement of the rally from the Aug. 26 low, around $88.00. The session low at $88.72 held well above that support, suggesting the move lower looked corrective rather than like a fresh bearish break.
The broader technical message is still constructive. Crude remains above its 50-day and 200-day moving averages, and RSI readings in the high 60s to low 70s show momentum is strong, if a bit stretched after the surge. The MACD has also turned up, reinforcing the idea that the trend is still tilted in the bulls’ favor. But strong trends need to keep proving themselves, and oil now needs a decisive close above the $92.87-$93.50 resistance band to open the door to a deeper advance.
Fundamentals are helping, but not enough to erase the chart’s caution flag. U.S. crude inventories fell by 4.45 million barrels, far more than expected, which usually supports prices by pointing to tighter supply. At the same time, traders are still dealing with mixed signals from refining bottlenecks, regional disruptions and broader global demand worries. That is why crude can rally hard on the week and still struggle to hold gains on the day: the market is trying to balance tightening supply against an uncertain growth backdrop.
That balance matters for investors because energy names can benefit quickly from sustained crude strength, especially cash-rich producers and integrated majors that convert higher prices into free cash flow and buybacks. But if oil loses momentum at resistance, the upside for the group can flatten just as fast. The recent move has improved the setup for bulls, yet it has not removed the risk of a pause.
For long-term investors, the bigger takeaway is simple: crude is back in a technically healthy trend, but it is now being asked to prove that the rally has real staying power. If buyers can punch through the $93 area, the case for higher energy prices becomes much stronger. If not, a pullback toward support would not be surprising. Either way, the next move should tell traders a lot about how much conviction is really behind this rebound, and it is worth watching closely.
| Entity | Gains | Losses |
|---|---|---|
| Crude oil bulls | ▲Higher-price breakout potential | ▼Stalled momentum at $93 resistance |
| Energy producers | ▲Better cash flow and pricing power | ▼Less upside if rally fades |
| Energy ETF holders | ▲Stronger sector performance | ▼Volatility if crude retreats |
| Short-term sellers | ▲Opportunity if resistance holds | ▼Squeeze risk on breakout above $93 |