Hayward’s weekly housing leaderboard was topped by a $2.025 million single-family sale, underscoring that high-end demand is still clearing the market even as affordability remains stretched across the East Bay.
Hayward Home Sales Top $2.025 Million
The 10 most expensive residential sales recorded in the week of Sept. 28 ranged from $1.125 million to $2.025 million, with the top home on Arundel Drive selling for about $457 a square foot. Across the city, 32 residential transactions averaged $980,528 and $571 per square foot, a reminder that even in a relatively limited sample, Hayward is still posting prices that reflect Bay Area scarcity more than broad-based affordability.
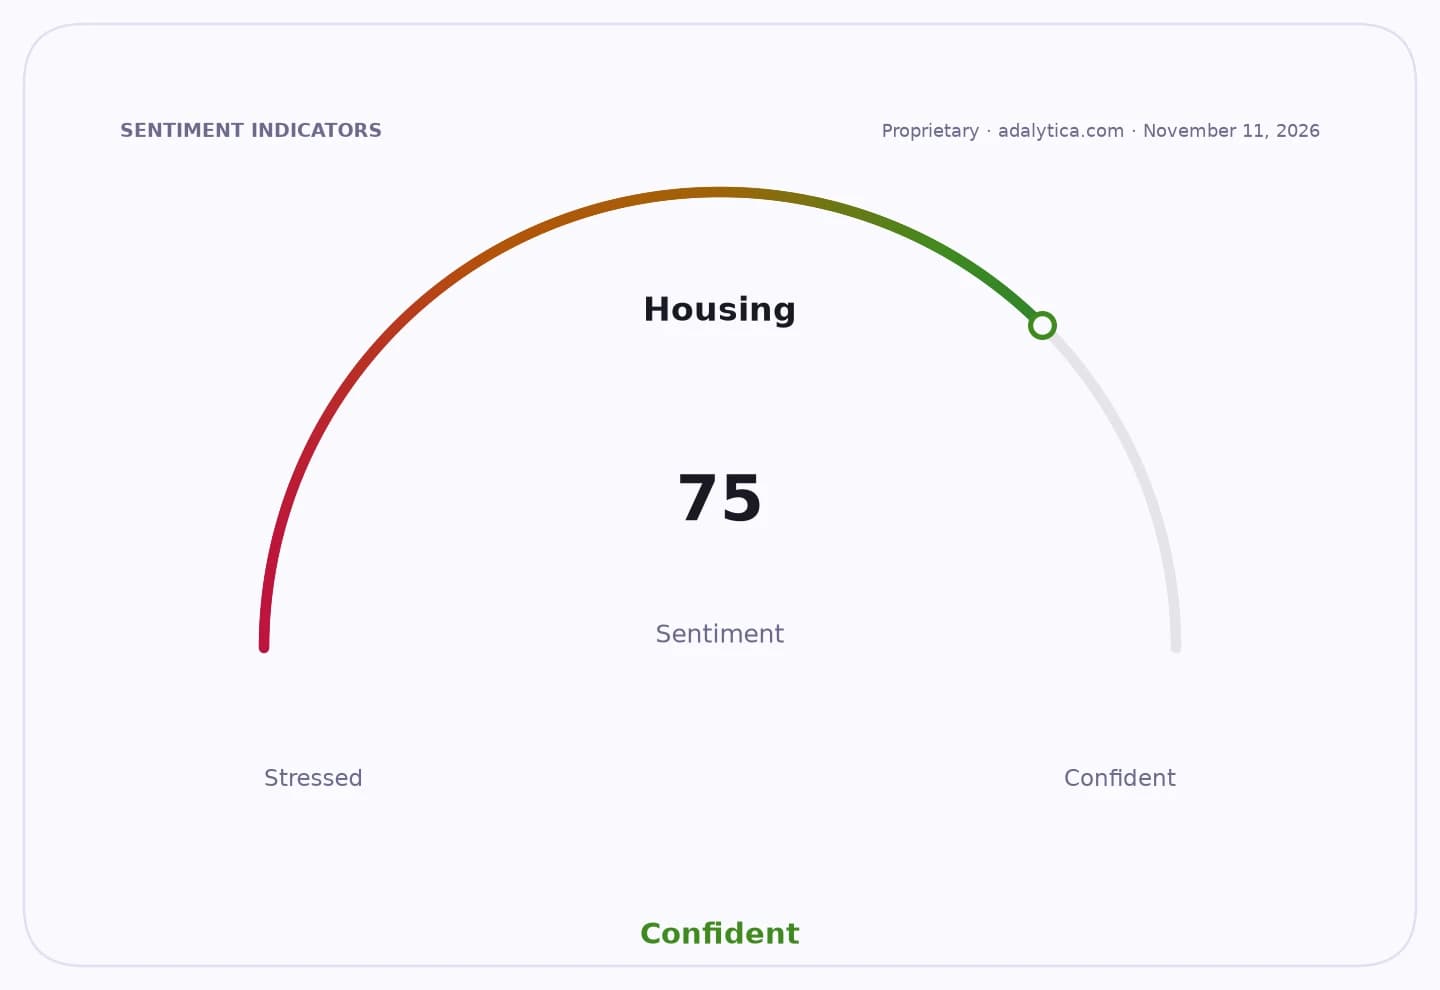
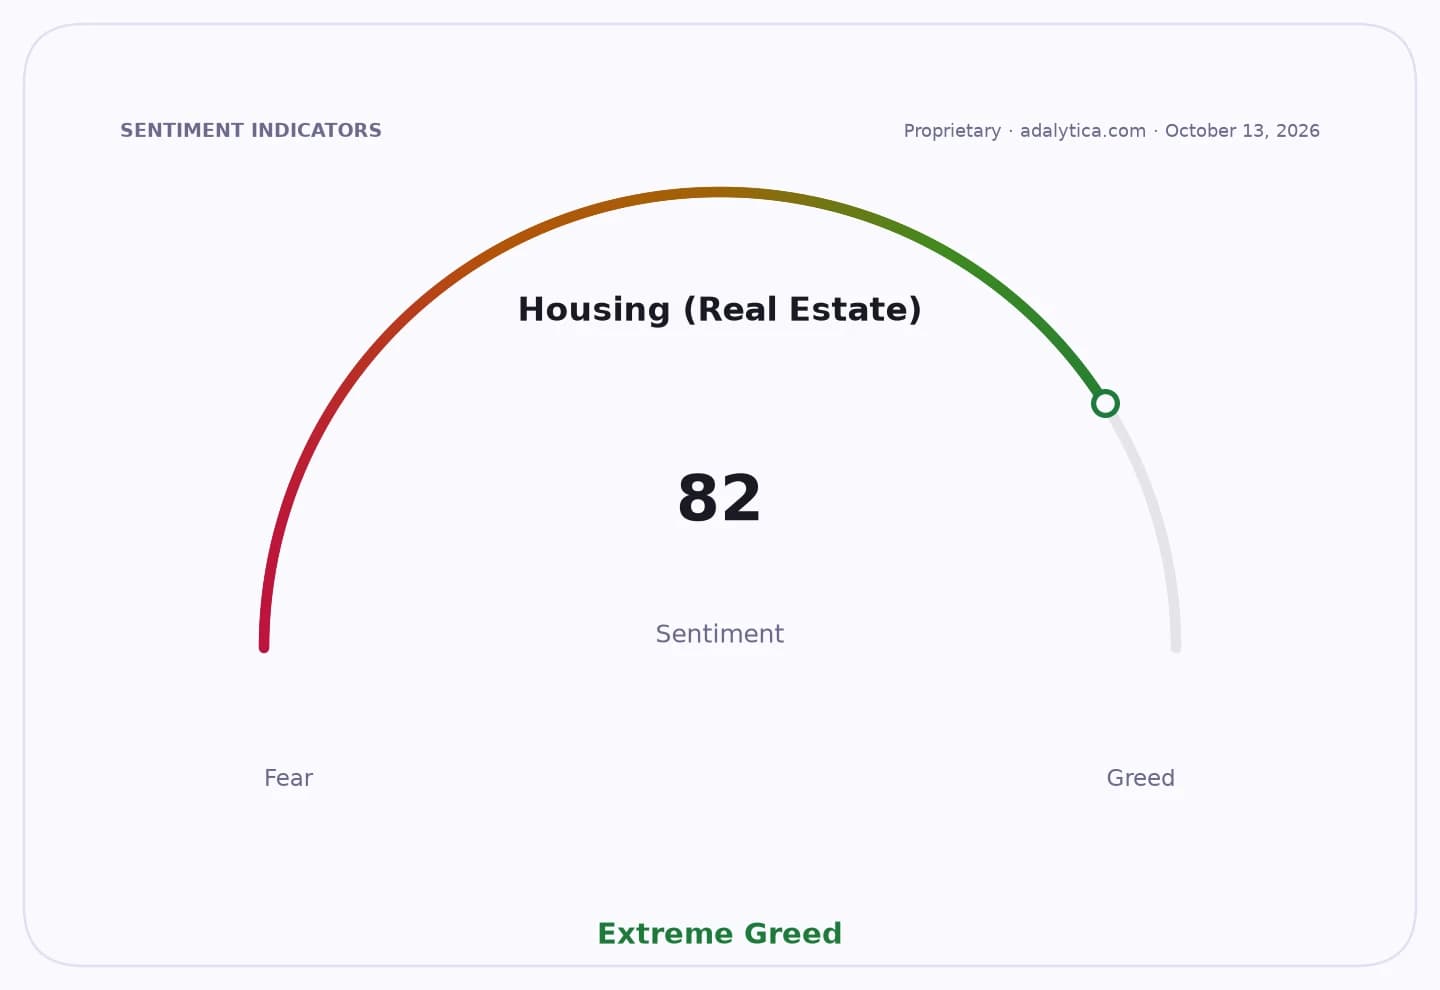
Sentiment Indicators
The priciest sale was a 4,434-square-foot home built in 2007, with four bedrooms and four bathrooms. Just below it, a five-bedroom house on Fox Hollow Drive sold for $1.938 million, while another home on Oak Pointe Court went for $1.8 million, showing that larger family homes in established neighborhoods are still drawing seven-figure bids.
The pattern matters for more than one city block. In a region where buyers are still contending with elevated borrowing costs and tight inventory, these closings point to persistent wealth in the local buyer pool and continued support for move-up housing values. For sellers, the data suggests premium homes can still trade at strong levels if they are well located and well sized. For buyers, it is another sign that the upper tier of the market has not meaningfully softened.
The week’s sales were recorded from title filings, meaning some deals closed in August but only appeared in the Sept. 28 reporting window. Even so, the spread between the lowest and highest prices on the list shows a market still anchored by demand for detached homes, with the strongest competition centered on newer or larger properties.
If mortgage rates stay elevated, that could keep the broader transaction count restrained even as top-tier homes continue to command premium pricing. The next tell will be whether Hayward’s median and upper-end sales can hold these levels into the fall selling season.
| Entity | Gains | Losses |
|---|---|---|
| Hayward sellers | ▲Strong premium pricing | ▼Fewer affordable entry points |
| Move-up buyers | ▲Choice in larger homes | ▼Higher financing costs |
| Local homeowners | ▲Supported property values | ▼Tougher affordability for newcomers |
| First-time buyers | ▲None | ▼Seven-figure barrier to entry |