OECD inflation climbed to 4.5% in September, a reminder that the disinflation story is not over and that energy remains the swing factor for global prices, central banks and asset markets.
OECD inflation rises to 4.5% on energy costs
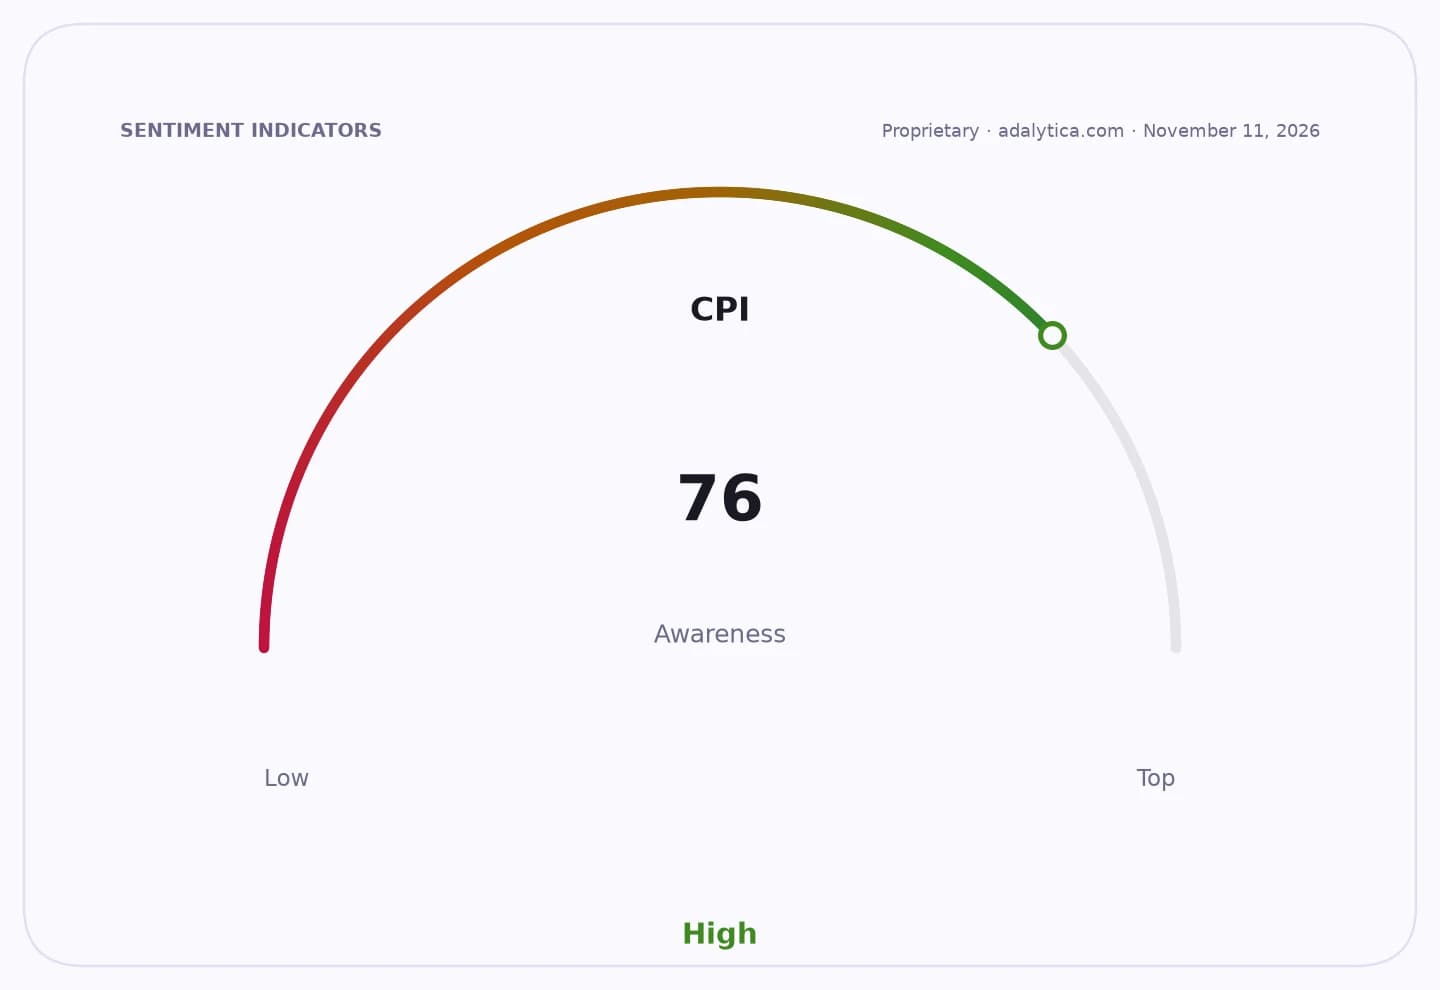
CPI
The increase from 4.3% in August was driven mainly by a sharp rebound in energy prices, which rose 17.4% year on year after a 13.6% gain the prior month. Energy prices increased in 31 of the OECD’s 37 member countries, underscoring how broad the inflation impulse has become. Core inflation, which strips out food and energy, was little changed at 3.7%, showing that the latest flare-up is still being led by the most volatile part of the basket rather than a fresh acceleration in underlying demand.
Sentiment Indicators
That matters because higher energy costs filter quickly into transport, manufacturing and household budgets, and they are already doing so across the biggest economies. In the G7, inflation rose in every member except Canada, while the energy contribution accounted for roughly half or more of the increase in France, Germany, Italy, Britain and the U.S. In the euro area, headline inflation accelerated to 3.8% from 3.2%, with energy inflation jumping to 18.9% from 14.3%. Eurostat’s preliminary October reading points to another rise to 4%, with energy inflation seen climbing further to 20.8%.
For investors, that combination is toxic for duration-sensitive assets and supportive for energy producers, commodity hedges and inflation-protected securities. It also keeps policymakers boxed in. The OECD said average prices in its member states are still more than 40% above December 2019 levels, with food nearly 50% higher and energy close to 70% higher. That means even a temporary energy rebound can quickly revive household inflation expectations and force central banks to stay cautious on rate cuts.
DCOILWTICO vs CPIAUCSL — macro contextadalytica.com
Explore this data interactively — full history, time series and cross-market comparisons.
The market already reflects that tension. Oil has been volatile, and the energy sector has outperformed broader equities in recent months even as defensive bond trades have struggled to gain sustained traction. U.S. crude fund USO remains well above its long-run average despite a recent pullback, while the energy sector ETF XLE is still trading far above where it started the year. Ten-year Treasury yields near 4.8% show how stubborn inflation risk continues to be priced into the bond market.
The investment implication is clear: the market is still underestimating how persistent energy-driven inflation can be when supply is tight and geopolitical risk remains elevated. That favors producers with balance-sheet strength, midstream cash flows and energy infrastructure plays over rate-sensitive sectors that need a clean disinflation path to re-rate. It also argues for owning real assets and inflation hedges before the next energy spike forces the consensus to reprice the macro again.
| Entity | Gains | Losses |
|---|---|---|
| Energy producers | ▲Higher realized prices | ▼Consumer demand pressure |
| Energy ETFs like XLE | ▲Sector outperformance | ▼Rate-sensitive growth trades |
| Bond holders | ▲Little to gain | ▼Higher inflation risk |
| Central banks | ▲N/A | ▼Less room to cut rates |