SOL is clinging to the $100 line after sliding below every near-term moving average, a setup that leaves the token vulnerable to a deeper move toward the $88 area if buyers fail to defend support.
Solana Holds $100 as Bears Target $88
The token was last quoted at $101.72 on Binance spot, down 0.49% over 24 hours, with trading volume of about $153 million. More important than the small daily decline is the technical structure underneath it: SOL is below the 7-day simple moving average at $104.17, the 20-day at $107.04, the 50-day at $109.66 and the shorter EMAs, showing sellers have control across multiple timeframes.
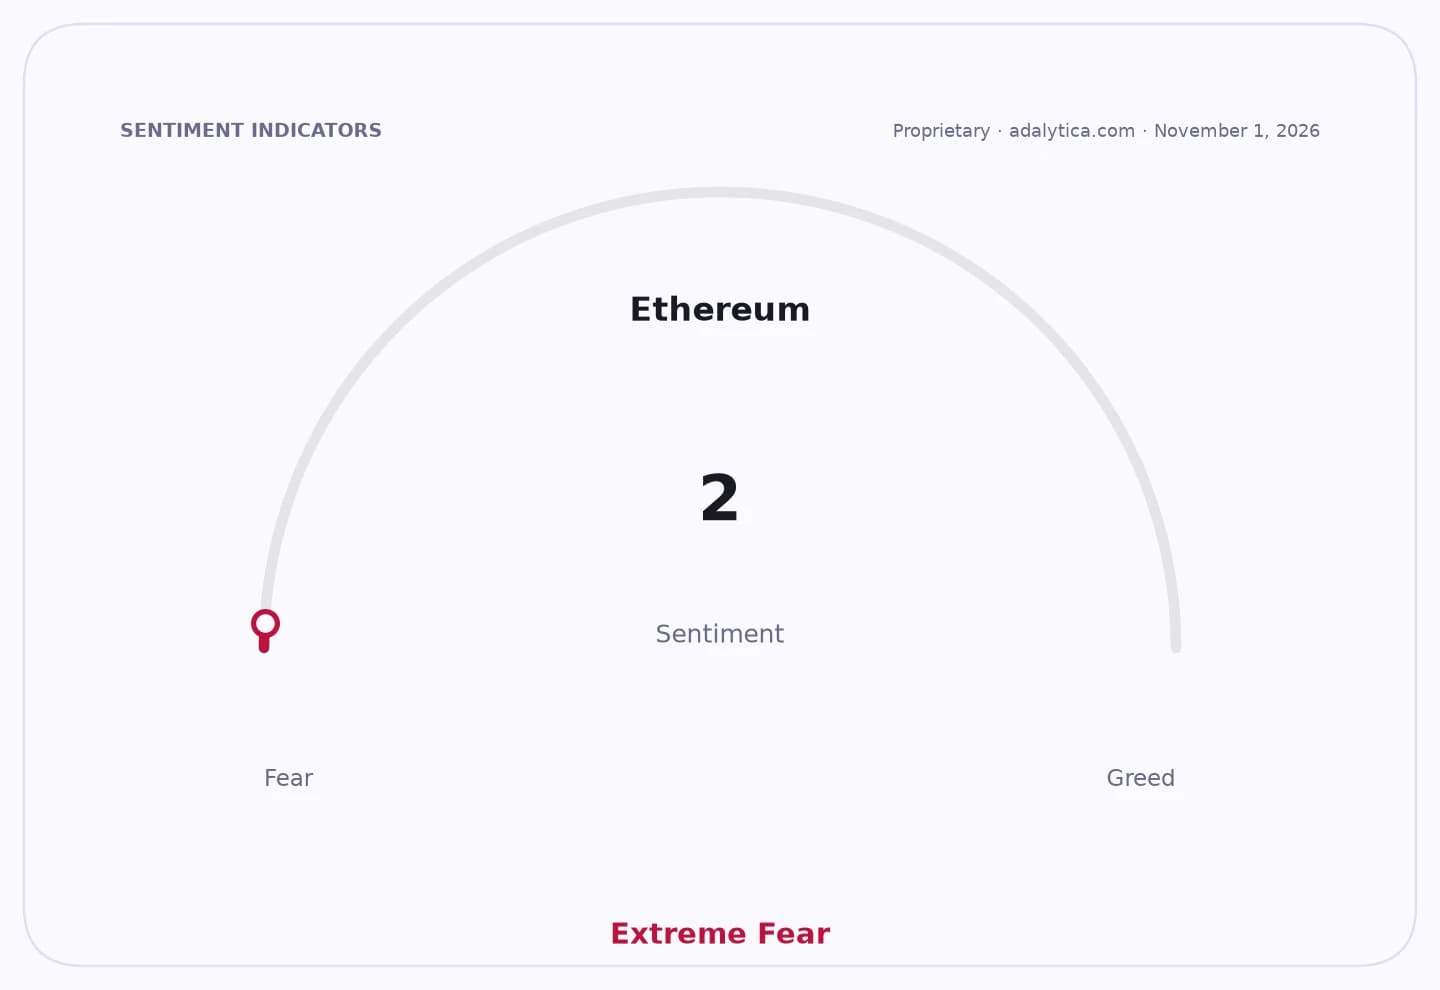
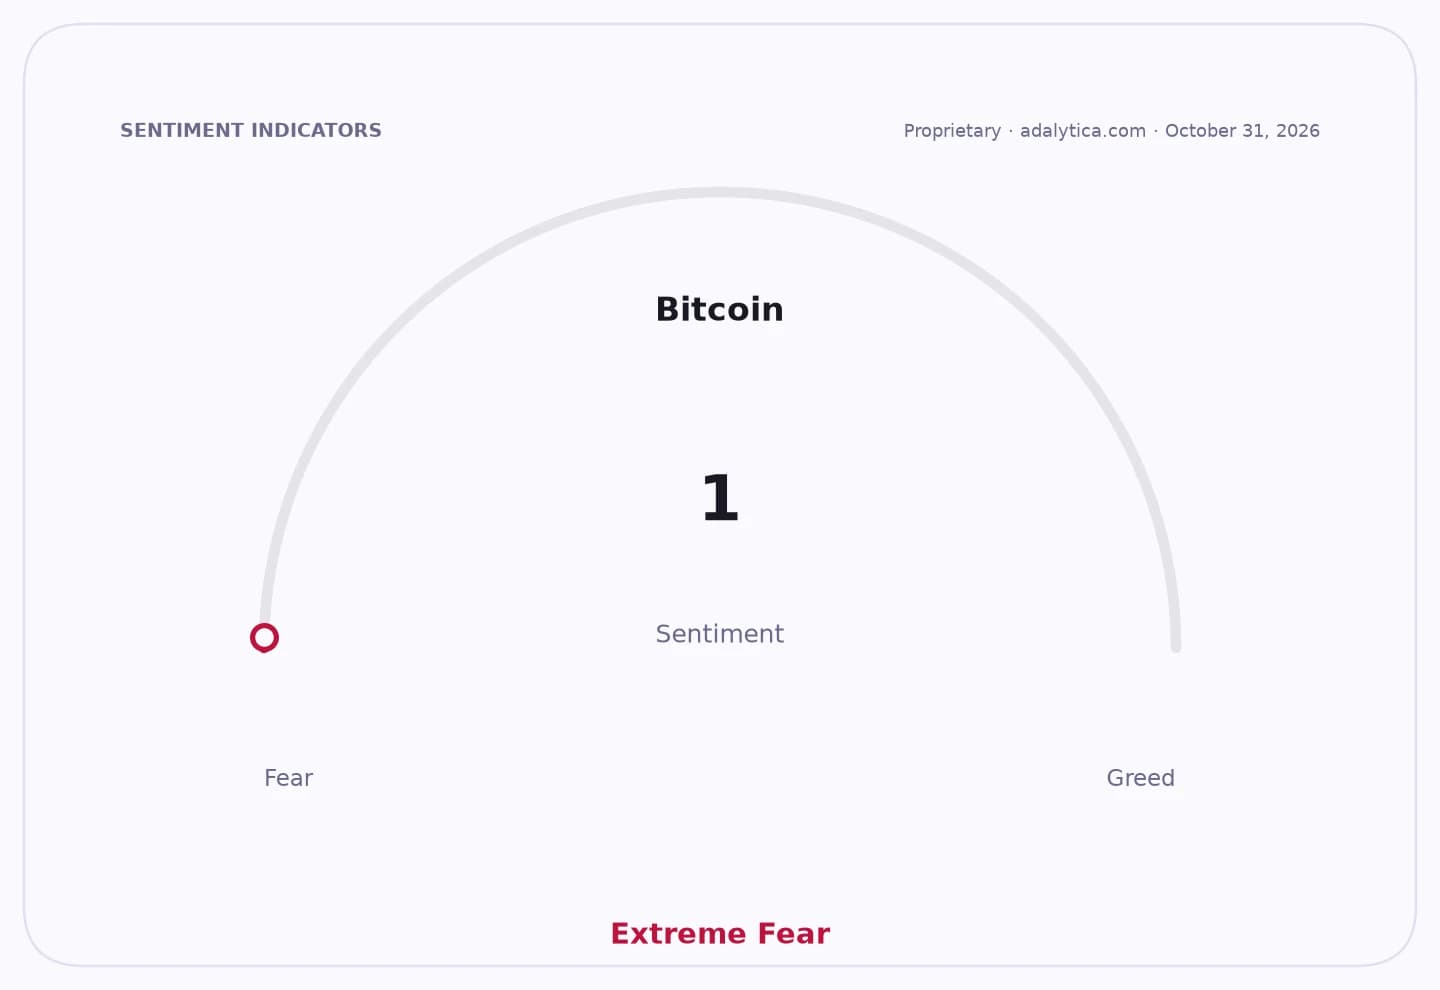
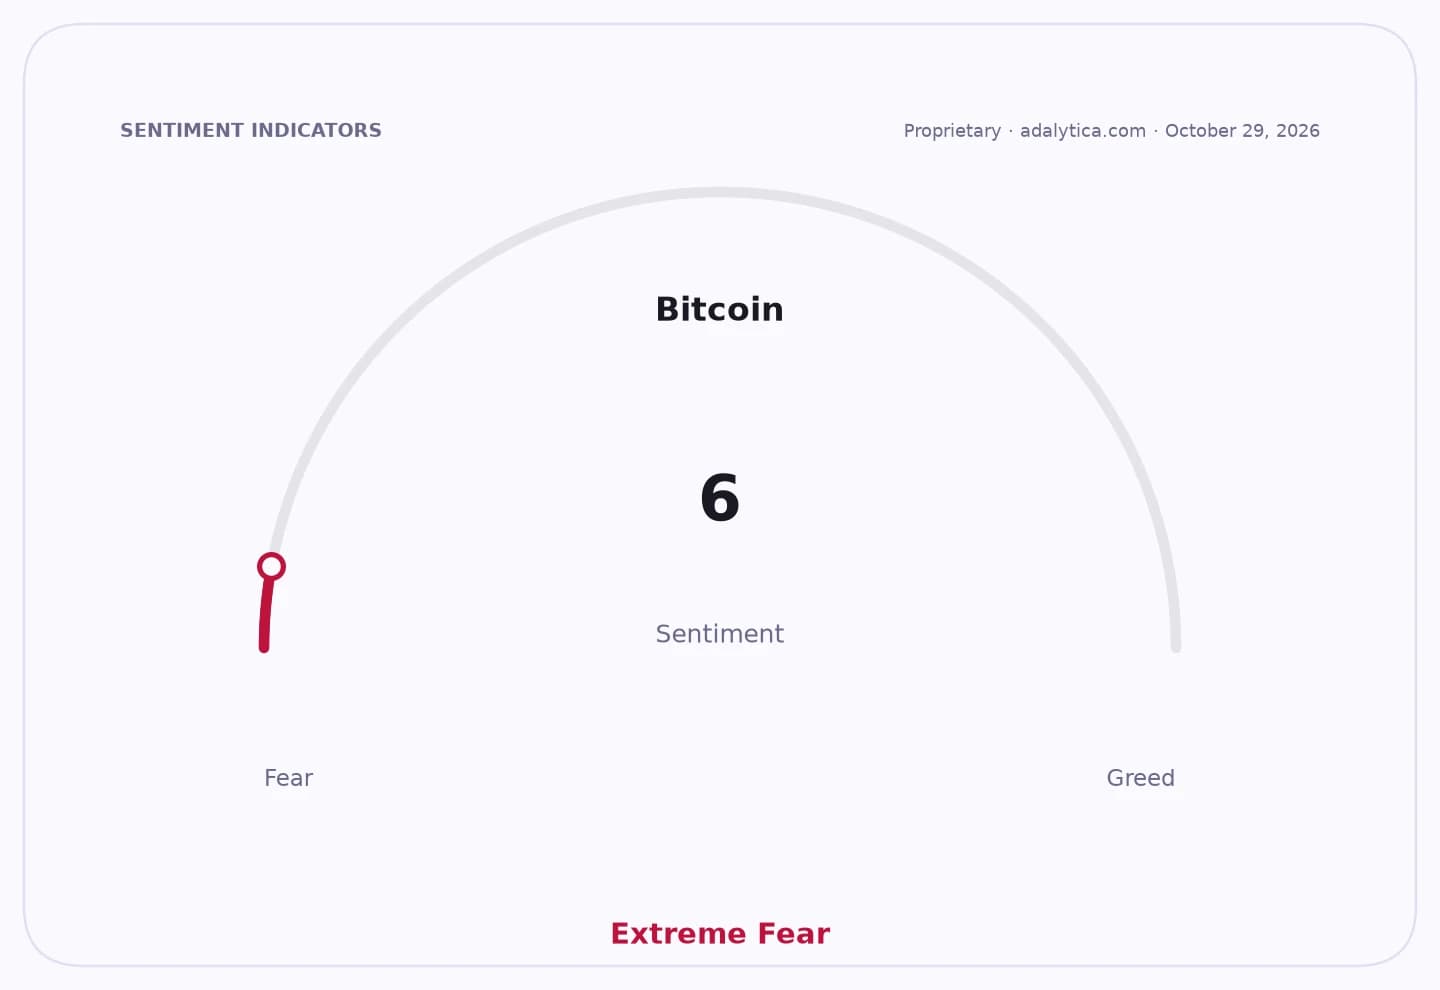
Sentiment Indicators
That matters because it shifts the focus from a routine pullback to whether the market can hold a psychologically important level that has become the pivot for the next leg. The one longer-term buffer is the 200-day SMA at $88.42, which sits well below current price and lines up closely with the bearish scenario flagged in the supplied analyst commentary.
Momentum is not collapsing, but it is weakening. The 14-day RSI at 36.46 is close to oversold territory, while the MACD histogram at zero suggests bearish pressure is flattening rather than accelerating. At the same time, SOL is trading near the lower end of its Bollinger Band range, with %B at 0.2148 and price just above the lower band at $97.71, reinforcing the view that the market is stretched to the downside but has not yet turned.
Derivatives positioning points to active selling, not conviction buying. Binance futures open interest slipped 0.58% to $873.6 million, while the 1-hour taker buy/sell ratio of 0.7730 shows sell volume outpacing buy volume in the latest window. That combination usually means traders are reducing exposure or pressing shorts rather than building new long positions.
Binance account data still shows more longs than shorts, with 73.8% of tracked accounts long and top traders even more skewed at 76.1% long. But that positioning has not translated into price strength, which suggests crowded optimism is being met by immediate supply.
For investors, the key near-term level is $100. A clean hold above that area could keep the door open to a rebound toward $103.45 and $105.19, with $114 as the more ambitious upside reference in the supplied trade map. A break below $99.30, however, would likely invite a test of the $96.89 strong support and then the $88 zone tied to the 200-day average.
With no fresh protocol or macro catalyst in the supplied data, SOL is trading as a pure technical market for now. The next move will likely be decided by whether buyers defend $100 or whether persistent selling pushes the token into a broader mean-reversion leg lower.
| Entity | Gains | Losses |
|---|---|---|
| SOL bears | ▲Breakdown toward $88 | ▼Momentum buyers |
| SOL bulls | ▲Hold above $100 | ▼If $99.30 breaks |
| Short-term traders | ▲Volatility around support | ▼Directionless chop |
| Binance longs | ▲A quick rebound above $103.45 | ▼Continued downside pressure |