US Treasury yields edged lower as investors positioned for Friday’s US payrolls report, with the 10-year yield at 4.79% and the 2-year at 4.39% on the latest data, both expected to drift further if hiring cools more than forecast.
US Treasury Yields Slip Before Payrolls Report

The move matters because the labor market is the clearest near-term test of whether the Federal Reserve can keep policy restrictive or has room to ease financial conditions later this year. A softer employment print would reinforce the view that growth is slowing enough to limit any further rate pressure, while an upside surprise would keep real yields elevated and Treasury prices under strain.
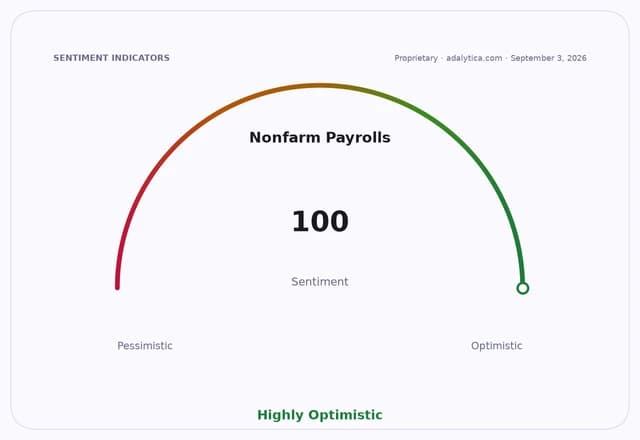
Sentiment IndicatorsⓘProprietary · adalytica.com · September 3, 2026
This is a snapshot — live sentiment, awareness and momentum for 130+ markets update continuously in the dashboard.Open AlphaPulse

Treasury futures reflected that caution. The iShares 20+ Year Treasury Bond ETF, TLT, rose to 82.10 on Sept. 3 from 81.87 two days earlier, while the iShares 7-10 Year Treasury Bond ETF, IEF, edged up to 92.29 from 92.18. Shorter-dated SHY was little changed at 81.71, underscoring how traders are still awaiting the payrolls catalyst rather than making a broad-duration bet.
The latest read on rate expectations is still centered on labor data. Adalytica’s PAYROLL gauge shows “Extreme Greed” at 100 for nonfarm payrolls sentiment, with awareness still low at 26, suggesting the market is leaning hard into the jobs release but has not fully broadened its conviction. Adalytica’s Treasury bonds signal remains in “Extreme Fear” at 3, a sign that bond traders are still wary of renewed selling if the report comes in hot.
Recent price action also shows the market is not yet fully committed to a sustained rally in bonds. TLT remains below its 50-day moving average at 83.01 and its 200-day average at 84.61, while its RSI reading of 53.0 suggests no oversold extreme. IEF is similarly trading below both its 50-day and 200-day averages, at 92.84 and 93.48 respectively.
Investors will now focus on whether payroll growth, wage gains and the unemployment rate confirm a slowing labor market or keep the Fed on guard. A weak report would likely extend the bid for Treasuries and pressure yields lower across the curve; a stronger one could quickly reverse the recent move and push the 10-year back toward the 4.8% area.
| Entity | Gains | Losses |
|---|---|---|
| Treasury bulls | ▲Higher bond prices | ▼Higher yields |
| Treasury bears | ▲Higher yields | ▼Bond prices |
| Fed doves | ▲More room to ease | ▼Less pressure to cut |
| Fed hawks | ▲Tighter policy case | ▼Rate-cut expectations |