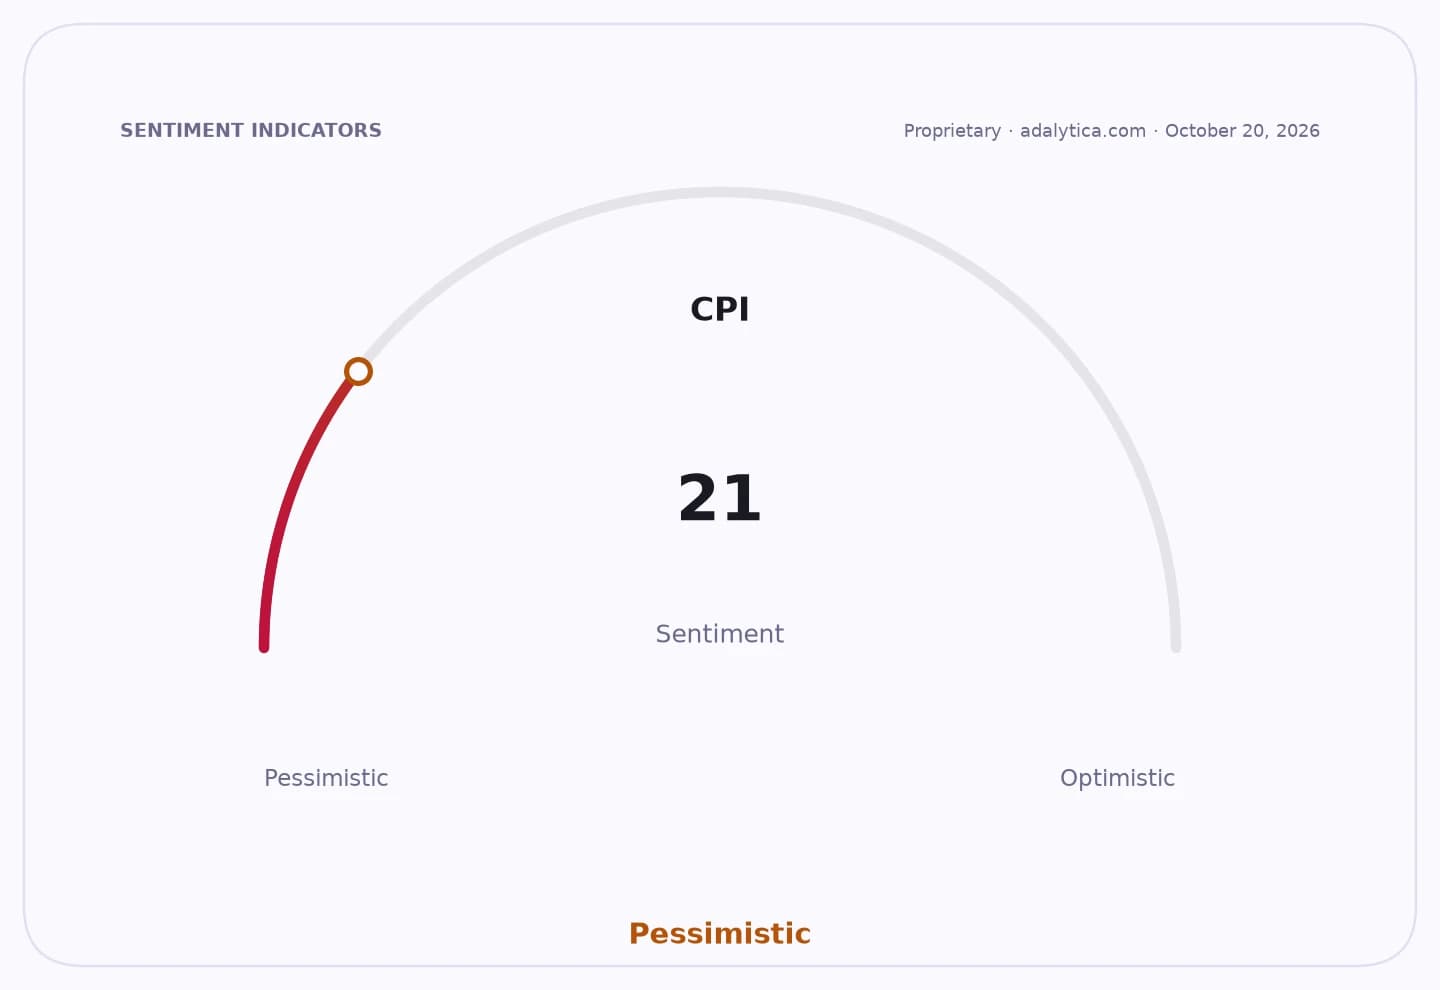
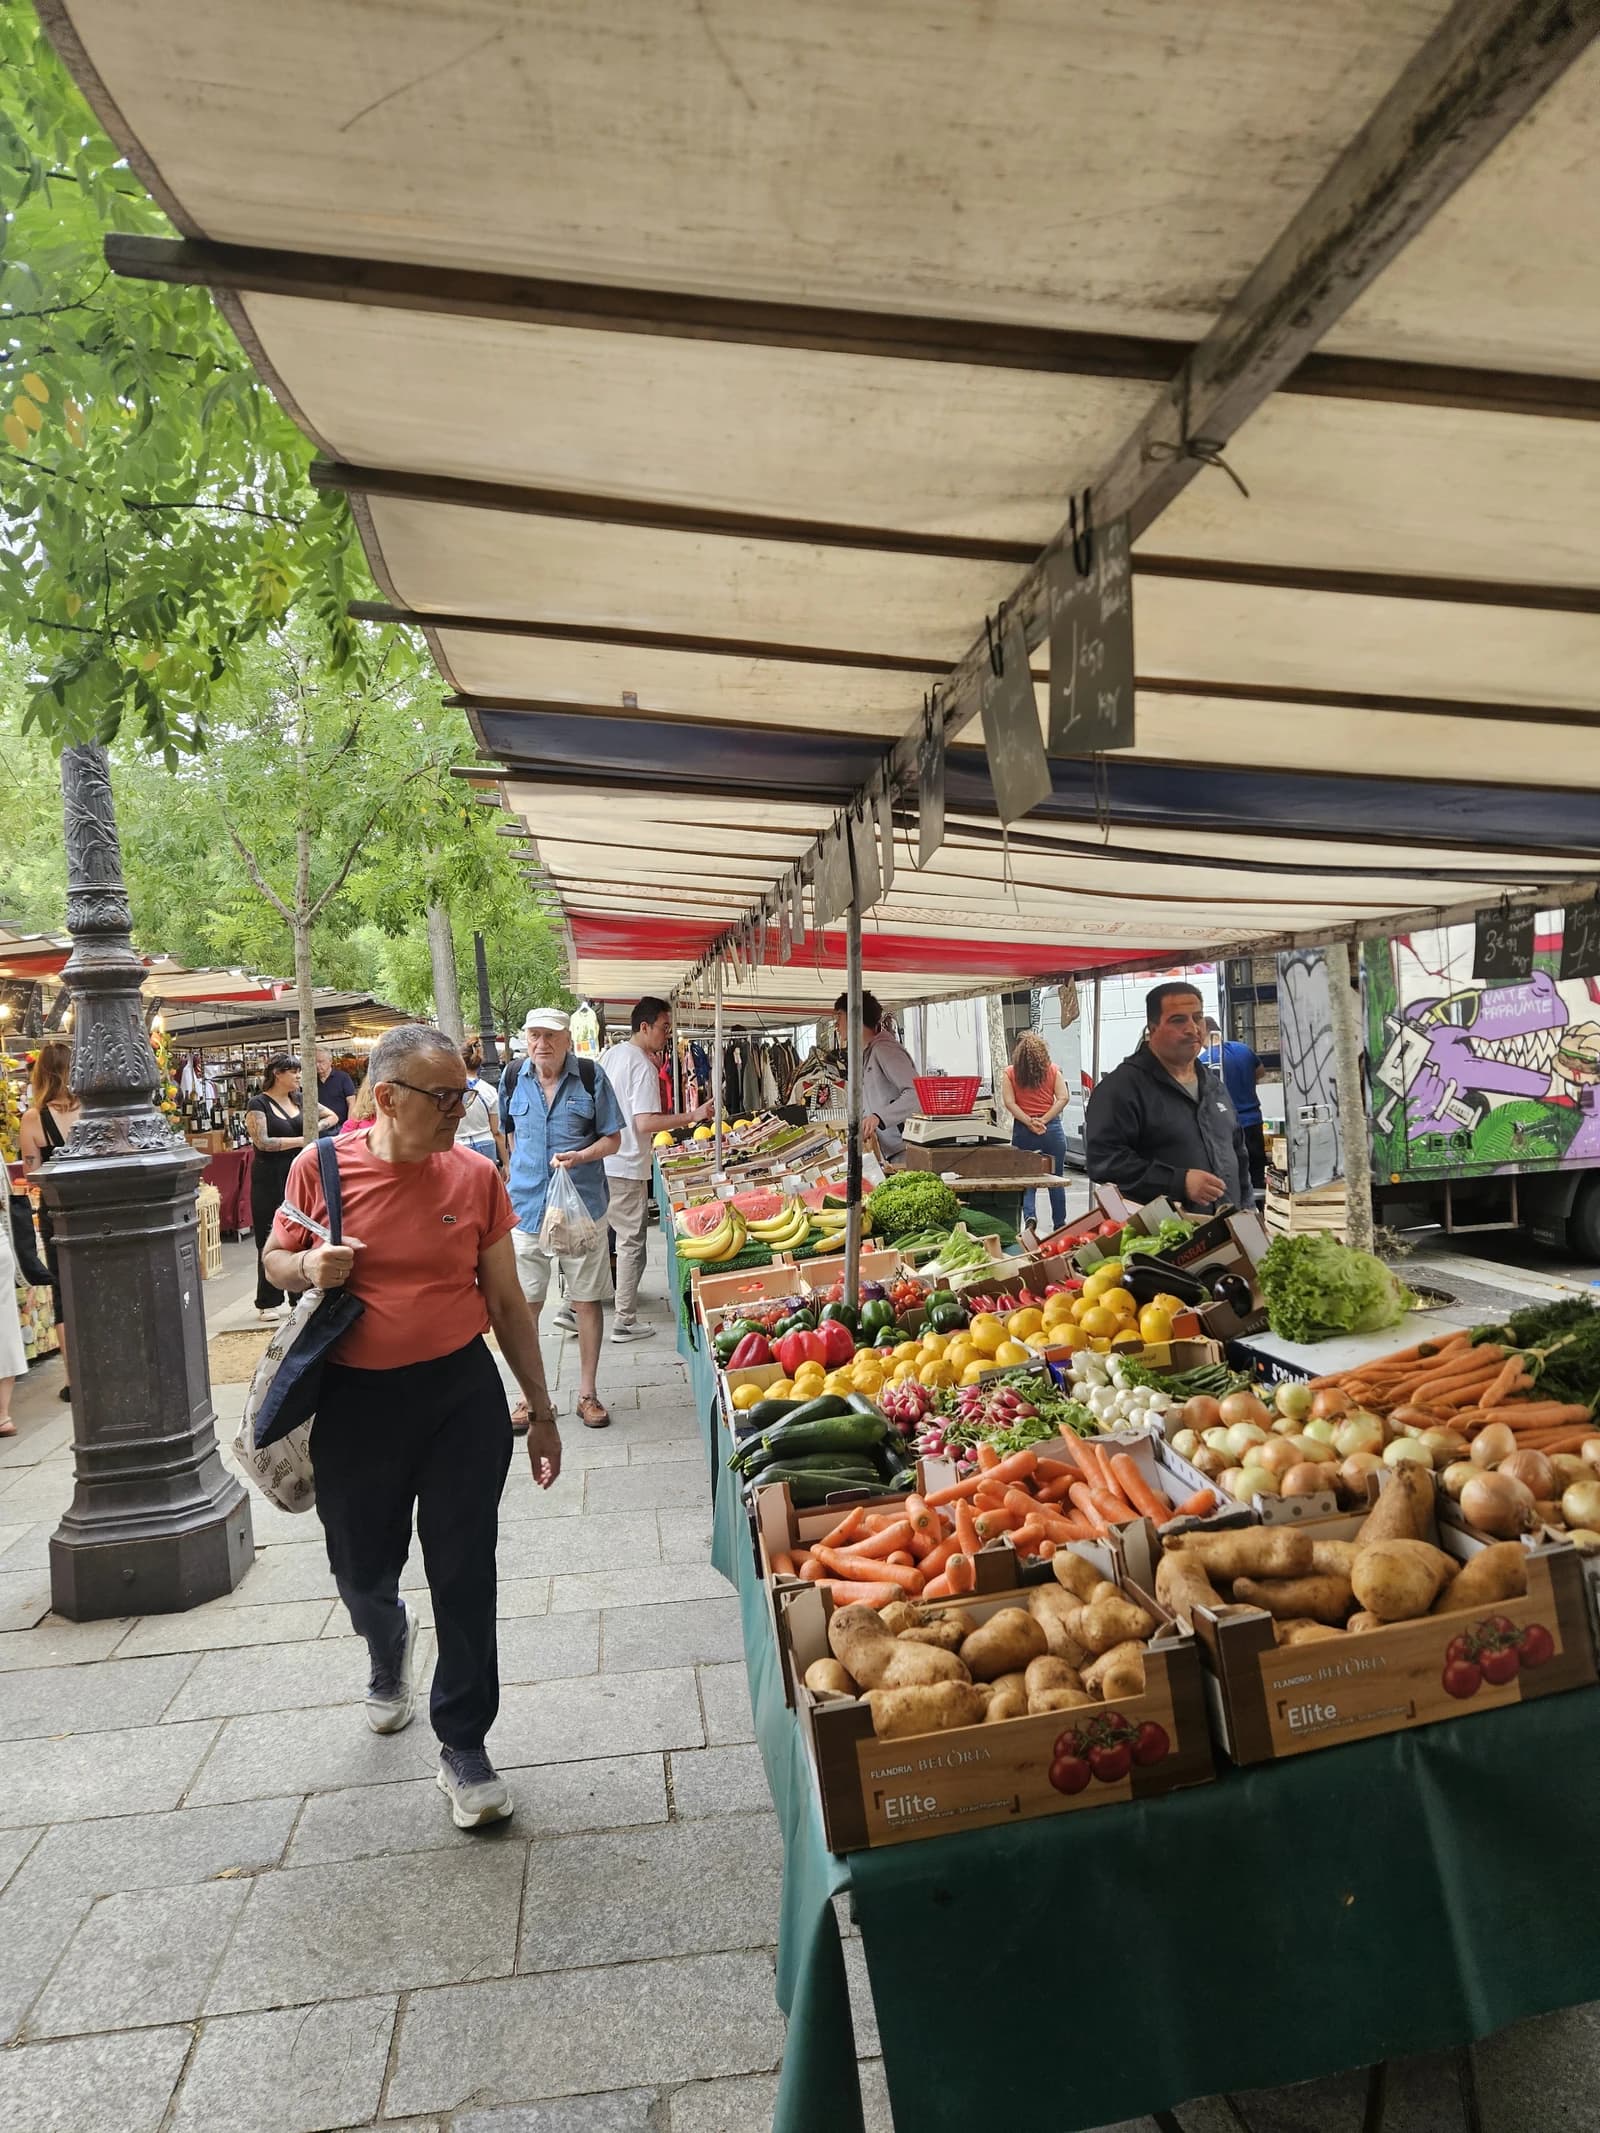
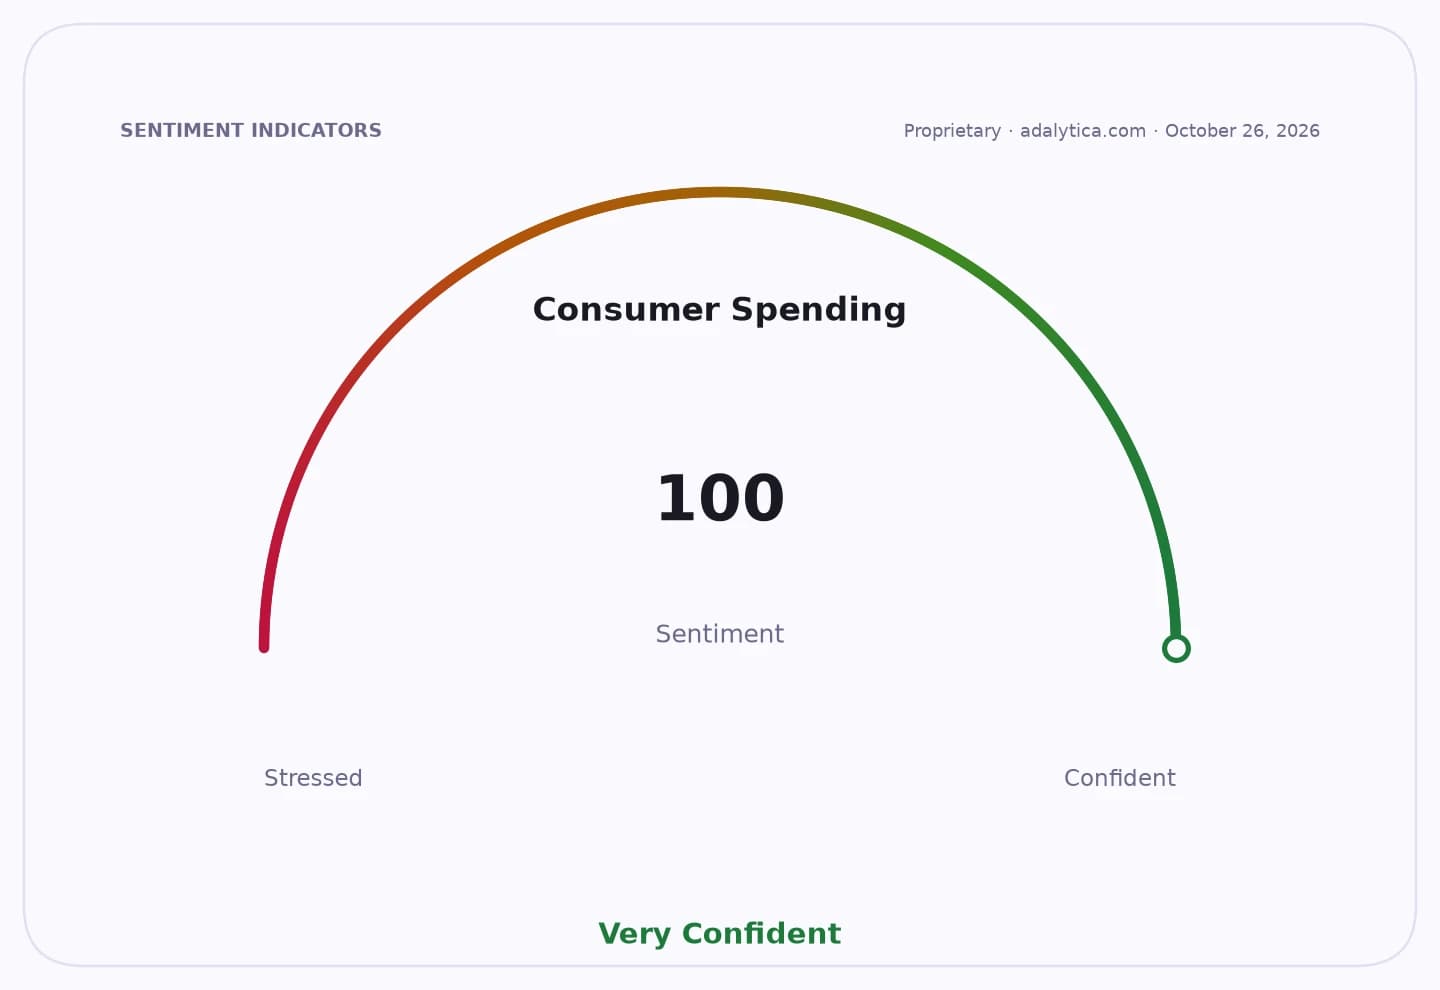
Waingapu’s annual inflation stayed at 3% in September 2026, and the main force behind that price pressure was clothing and footwear — a reminder that even in a relatively small local economy, consumer spending shifts can move the inflation needle in a meaningful way.
Waingapu Inflation Stays at 3% as Clothing Rises
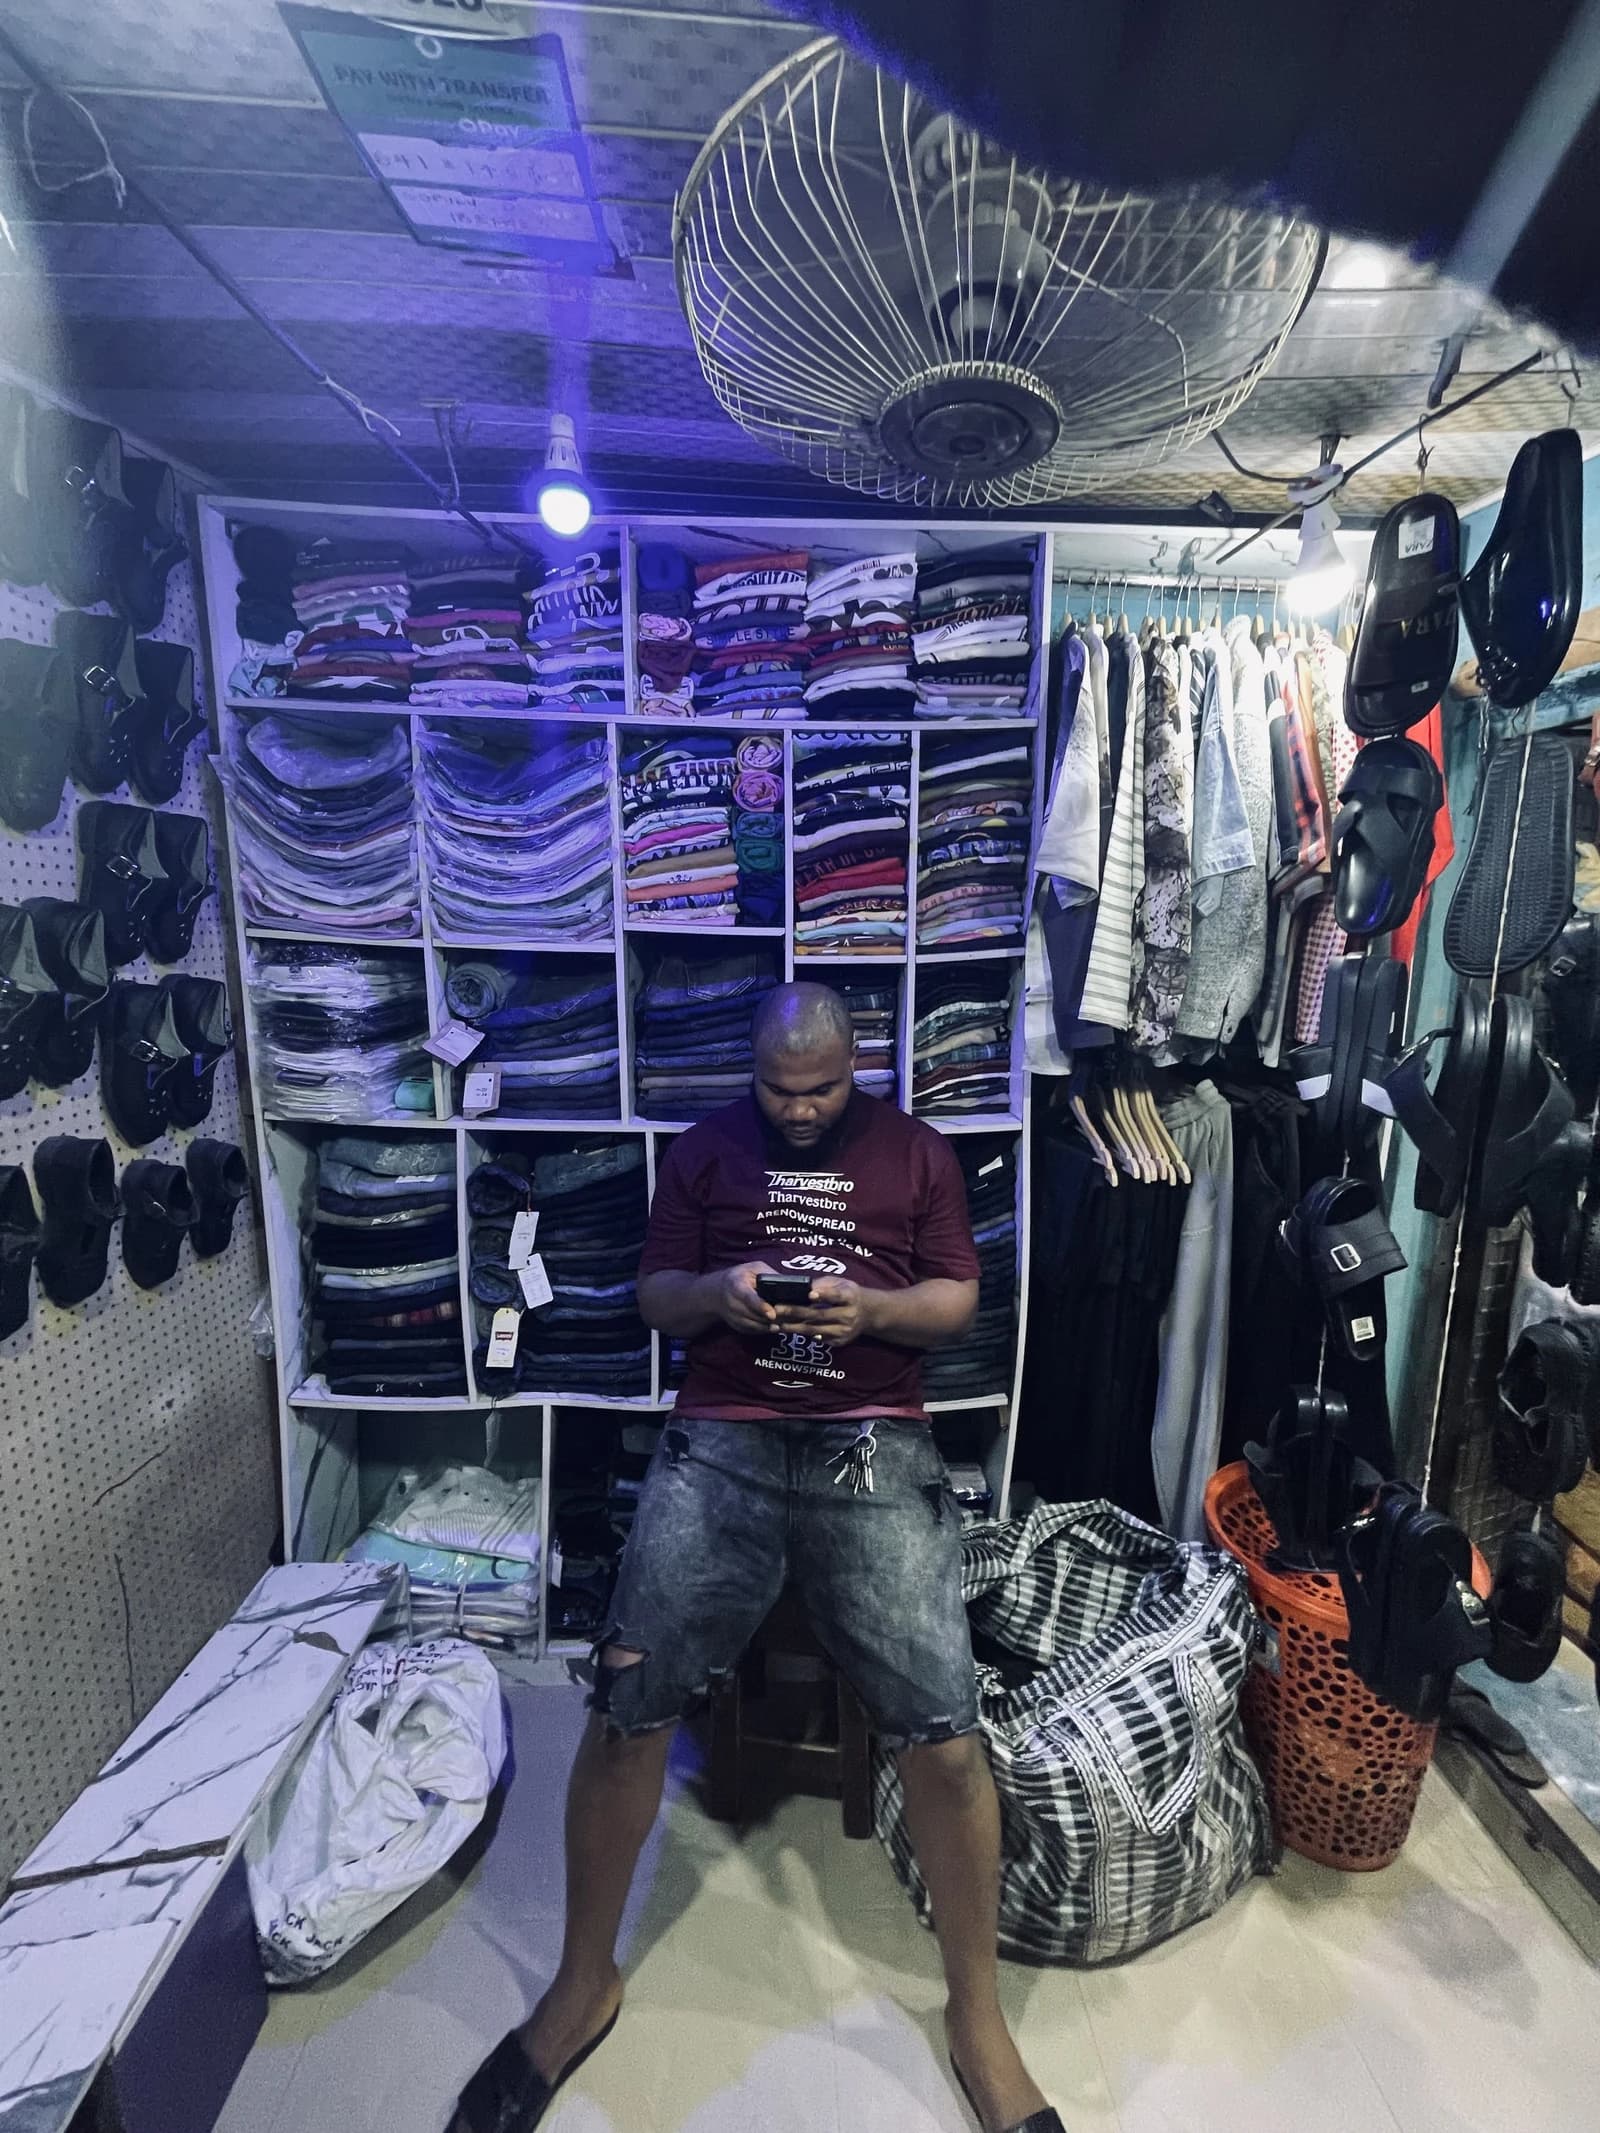
That matters because inflation is not just a statistic. For households, it affects purchasing power. For businesses, especially retailers and apparel sellers, it can support pricing power and revenue growth. For investors, it helps explain where consumer demand is strongest and which categories may be able to defend margins even if the broader economy is uneven.
Sentiment Indicators
According to Indonesia’s statistics agency, BPS, clothing and footwear posted the highest annual inflation among 11 spending groups at 7.07%. Clothing alone rose 8.46%, while footwear increased 1.34%. By contrast, the health category was a drag, falling 2.47% on an annual basis, with medicines and health products down 3.82%. In other words, the inflation story in Waingapu is being driven less by broad-based price pressure and more by a specific consumer category tied to everyday spending.
For long-term investors, that kind of split is worth watching. It suggests demand is not uniformly strong across the local economy, but apparel appears resilient enough to pass through higher prices. That is the sort of environment that can favor retailers with brand strength, product mix flexibility and disciplined inventory management. It also fits a broader consumer trend: when households continue to spend on clothing even as other categories soften, the winners tend to be companies that can capture that demand without sacrificing margins.
The stability of the headline inflation rate at 3%, unchanged from August, also suggests prices are not accelerating across the board. That gives policymakers and businesses a little more clarity, even if the composition of inflation remains uneven. Historically, Waingapu’s inflation has been more volatile, with a peak of 4.19% in February 2026 and a low of minus 0.16% in February 2025, so September’s reading looks more like a steadying pattern than a new inflation shock.
For investors, the takeaway is simple: look past the headline number and focus on what is actually getting more expensive. In Waingapu, it is clothing and footwear, not the broader basket. That makes the apparel chain the most important signal in the report — and a category worth tracking for both pricing power and consumer demand over the next several quarters.
| Entity | Gains | Losses |
|---|---|---|
| Clothing retailers | ▲Higher pricing power | ▼Cost-conscious shoppers |
| Footwear sellers | ▲Stronger category demand | ▼Health-sector sellers |
| Waingapu consumers | ▲Product availability | ▼Real purchasing power |
| Local inflation watchers | ▲Clearer category signal | ▼Broad-based relief from prices |