Wheat is trading around 705 US cents a bushel because the market is pricing a supply chain blockage, not a true crop shortage — and that distinction matters for anyone betting on the next big move in grains.
Wheat Holds Near 705 Cents on Black Sea Disruption
The most important fact here is that exports from Russia and Ukraine, which normally account for about a quarter of globally traded wheat, have effectively collapsed under Black Sea shipping attacks and logistics bottlenecks. In August, combined shipments from the two countries fell to less than 2.5 million tons from 6.3 million a year earlier, and September volumes are running at only token levels. That has tightened physical availability in importing regions even as global production estimates continue to rise.
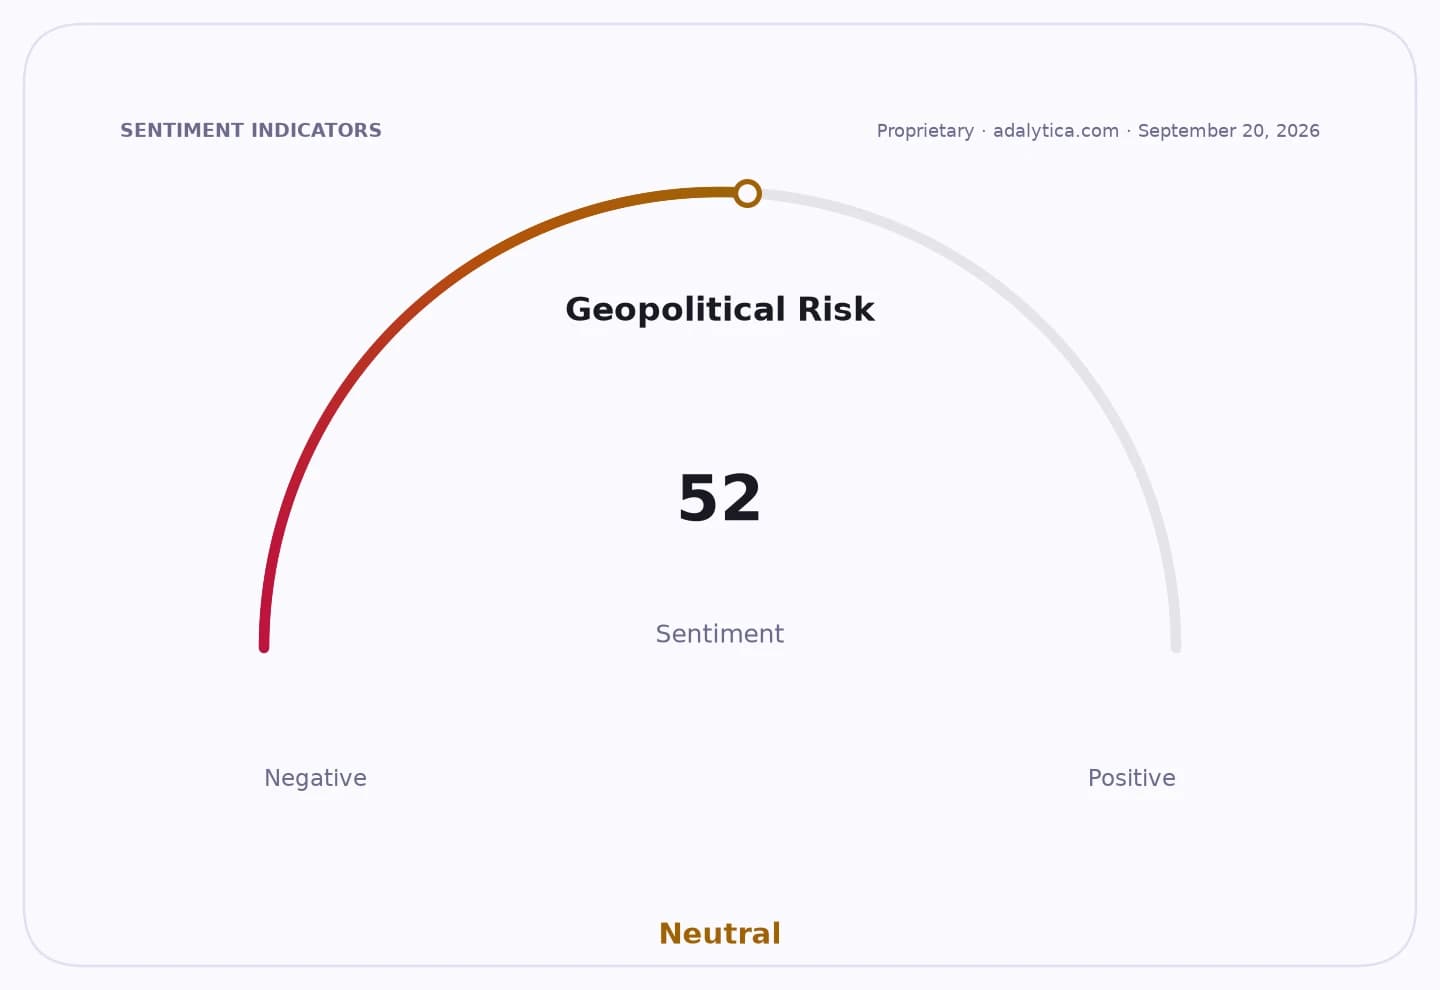
Sentiment IndicatorsⓘProprietary · adalytica.com · September 30, 2026
This is a snapshot — live sentiment, awareness and momentum for 130+ markets update continuously in the dashboard.Open AlphaPulse
That is why wheat can stay elevated even after sliding from a September peak of 794.84 cents to 704.91 cents now. The market is still well above July’s low of 566.79 cents, and the underlying driver has not disappeared. In other words, this is not the kind of rally that simply fades when a crop comes in big; it is a geopolitically driven dislocation that can persist until shipping routes reopen.
For investors, the setup is asymmetric. If the Black Sea corridor remains blocked, the market keeps paying up for alternate origins such as Romania, Bulgaria and France, while feed wheat demand stays firm and end users in North Africa and Asia keep chasing supply. But if a new grain deal or shipping arrangement emerges, the missing volumes could return within weeks, and prices would likely give back a large part of the move. That makes wheat a classic event-driven trade rather than a simple weather story.
European harvest data are not enough to offset the shock. The EU is harvesting 133.2 million tons this year versus 143.4 million last year, and Germany is seen at 19.1 million tons, down 15%. Paris wheat futures have already responded, with December contracts around 256 euros a ton in early September, roughly 20 euros higher than four weeks earlier. At the same time, the US Department of Agriculture still sees the average farm price for the current season at $6.40 a bushel, below the cash market, but it has already lifted that estimate by 20 cents — a sign that the market’s transport bottleneck is forcing official expectations higher.
The longer-term narrative is that wheat is no longer trading like a clean agricultural market; it is trading like a geopolitical commodity with multiple chokepoints. Global output for 2026/27 is still projected to edge up to 820 million tons, and total supply to 1.103 billion tons, while ending stocks rise. But stocks do not help if the grain cannot move. That is the key investment insight the market underestimates.
Technical positioning also supports the case for tactical upside. The stock-traded wheat fund WEAT remains above its 200-day moving average, but recent price action has pulled back sharply from a summer spike, with the 50-day moving average now around $25.55 and the ETF closing at $24.58 on Sept. 30. Momentum has cooled, and the RSI reading is deeply oversold, which suggests the market is vulnerable to another squeeze if Black Sea headlines worsen or if physical supply tightens again.
The trade, then, is not just long wheat — it is long disruption. Producers with export access, especially outside the Black Sea, stand to benefit if the blockade persists. Importers, flour millers and food processors face the risk of renewed cost pressure. And for traders, the real catalyst is simple: any sign that the Black Sea stalemate is becoming a prolonged structural break could take wheat back toward the 800-cent area, while a diplomatic breakthrough would be the sharpest bearish catalyst in months.
| Entity | Gains | Losses |
|---|---|---|
| Non-Black Sea exporters | ▲Higher pricing power | ▼Lose share if exports normalize |
| Importers in North Africa and Asia | ▲None | ▼Face higher food costs |
| Wheat bulls / long positions | ▲Disruption premium | ▼Supply normalization risk |
| Black Sea exporters | ▲None | ▼Blocked shipments and revenue loss |