US crude, gasoline and distillate inventories all fell last week, reinforcing a tighter near-term fuel balance just as Middle East supply risks keep crude prices elevated and energy equities pinned near recent highs.
Crude, gasoline and distillate inventories fell last week
Sources citing American Petroleum Institute data said crude stocks dropped 4.9 million barrels in the week ended Oct. 16, while gasoline inventories fell about 2 million barrels and distillate stocks declined 2.6 million barrels. The inventory draw points to steady demand and potentially firmer refinery runs, even as traders continue to price in disruption risk across key shipping routes.
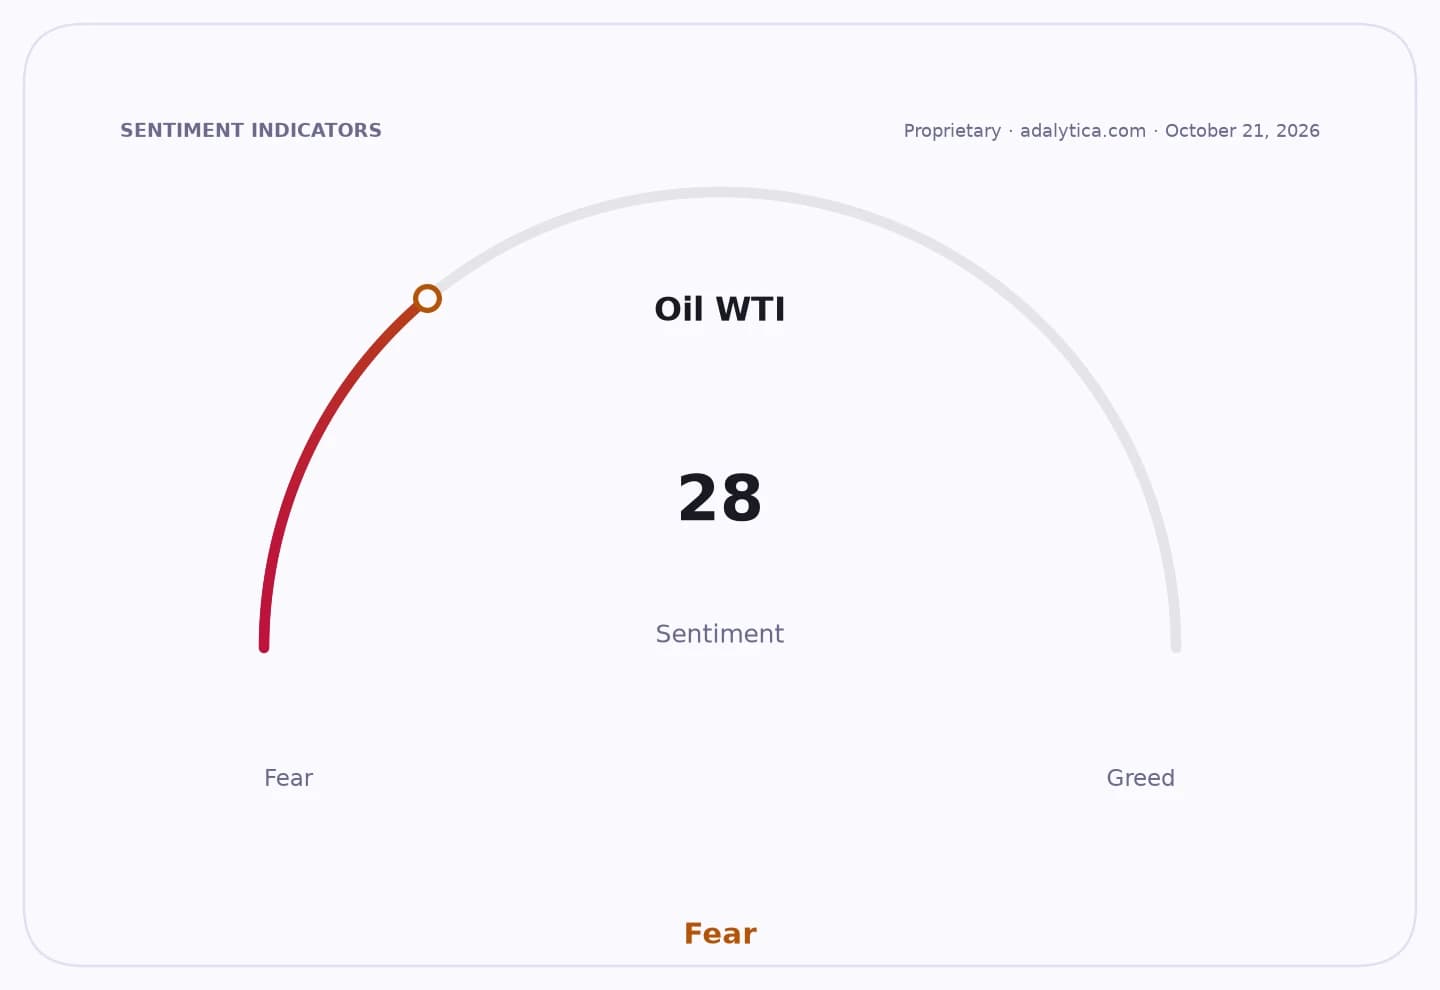
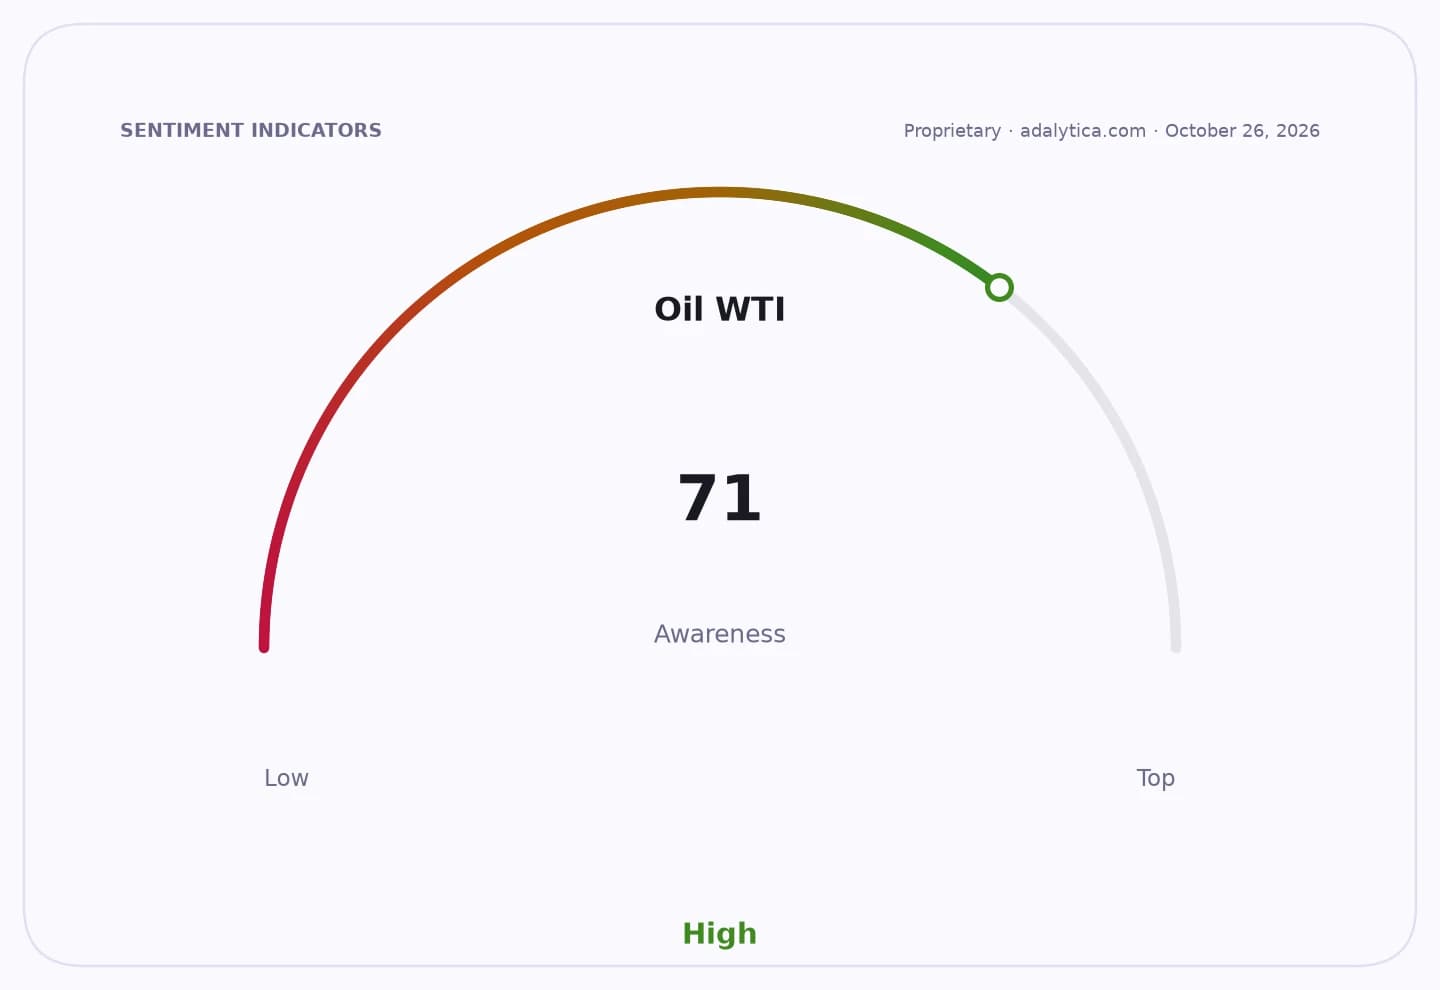
Sentiment IndicatorsⓘProprietary · adalytica.com · October 26, 2026
This is a snapshot — live sentiment, awareness and momentum for 130+ markets update continuously in the dashboard.Open AlphaPulse
The move matters because inventory draws across all three major product categories can support oil benchmarks and refining margins at the same time. That combination is especially relevant when supply fears are already amplifying prices: Brent was last quoted around $110 a barrel and West Texas Intermediate near $99 in the market data cited alongside the API report.
Energy shares have already reflected that backdrop. The Energy Select Sector SPDR Fund, or XLE, rose to $69.33 on Oct. 23, after gaining more than 6% from the Oct. 15 close, while the United States Oil Fund, or USO, climbed to $169.53, with its relative strength index pushing into overbought territory on conventional technical measures. The gains suggest investors are still leaning into the crude rally rather than fading it.
Natural gas has been a different story. The United States Natural Gas Fund, or UNG, slipped to $9.58, underscoring that the current energy bid is concentrated in oil rather than across the broader complex.
The market still faces a second test from the official US government stockpile data, which can confirm or temper the API signal. If the Energy Information Administration report also shows broad draws, it would strengthen the case for sustained price support and keep pressure on consumers and import-dependent refiners, while oil producers and integrated energy companies stand to benefit most.
| Entity | Gains | Losses |
|---|---|---|
| Oil producers | ▲Higher crude prices | ▼Demand destruction risk |
| Energy equities | ▲Stronger earnings outlook | ▼Overbought volatility |
| Refiners | ▲Wider product spreads | ▼Higher input costs |
| Consumers/importers | ▲Cheaper energy if prices retreat | ▼Fuel inflation if draws persist |