The Dow Jones Industrial Average is back under pressure, with technicians pointing to a test of its July low as Treasury yields climb, the dollar hits a two-month high and the market leans into the prospect of another Federal Reserve rate increase.
Dow Jones Tests July Low as Yields Rise

That mix matters because higher rates and a firmer dollar tighten financial conditions across asset classes at the same time, weighing on equities while supporting the yen-cross trade and lifting some commodities. The 10-year Treasury yield is pushing higher, the two-year yield has risen to 4.79%, and futures are now pricing in a 54% chance of an October rate hike, keeping investors focused on the Fed’s path rather than on earnings alone.
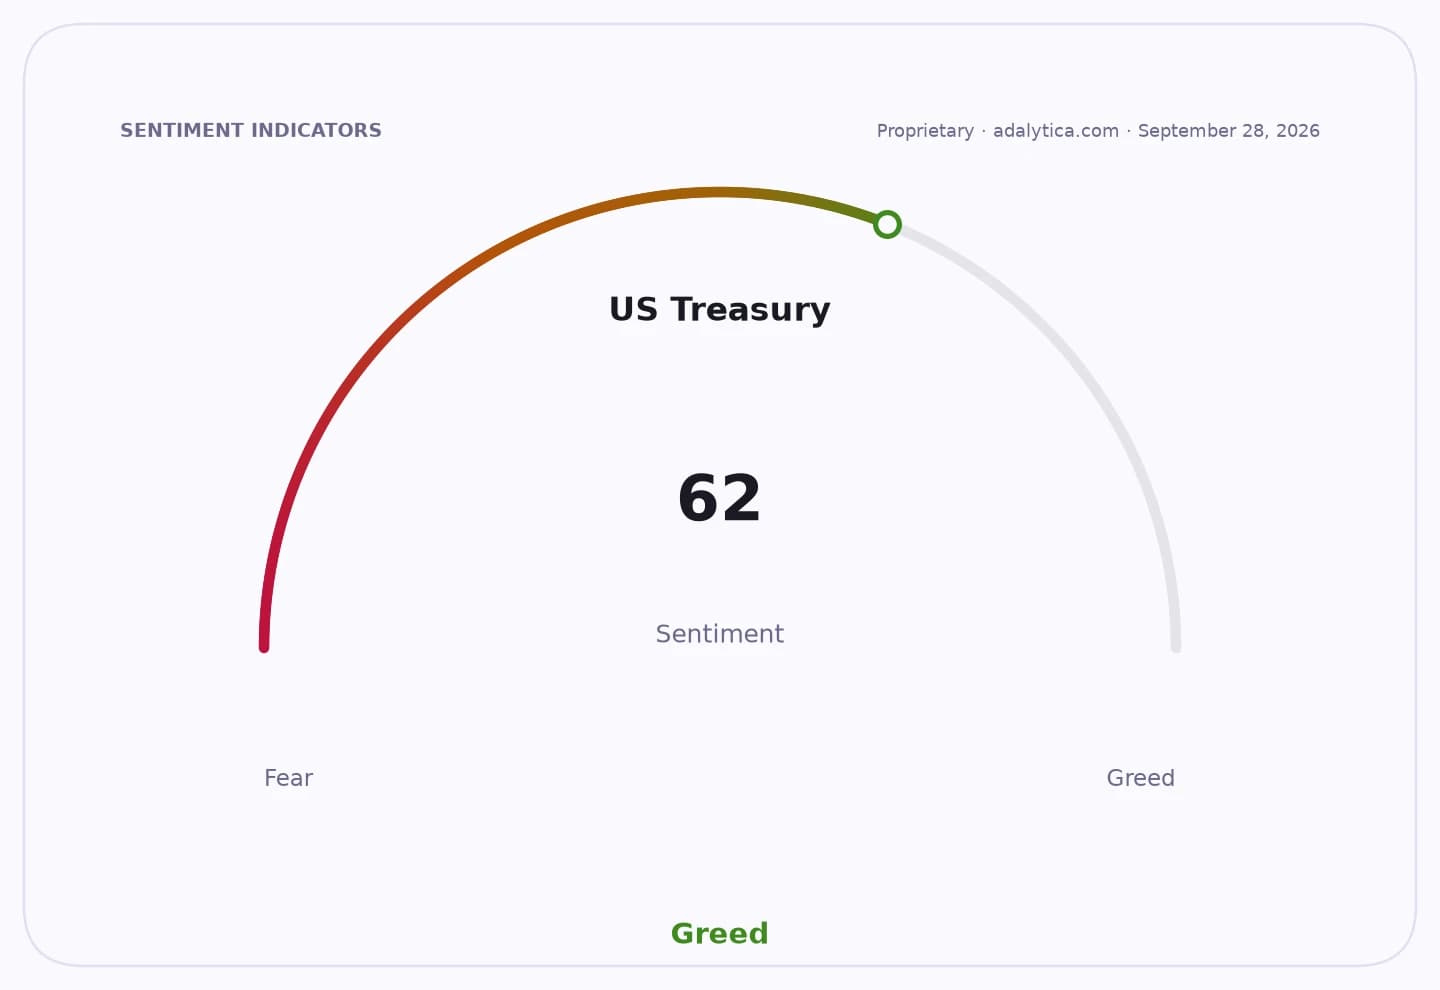
Sentiment IndicatorsⓘProprietary · adalytica.com · September 28, 2026
This is a snapshot — live sentiment, awareness and momentum for 130+ markets update continuously in the dashboard.Open AlphaPulse
For the Dow, the technical picture has deteriorated as the index resumes its descent toward 51,547, the July trough, with a break there exposing the March-to-September uptrend line around 51,450 and then the September low at 51,192. The index would need to recover above Tuesday’s 52,324 high to ease the pressure and put 52,516 and the 52,661-to-52,760 resistance zone back in play.
The move comes as the S&P 500 remains in a risk-on mood in some corners, with Adalytica’s SPY trade signals showing “Extreme Greed,” but the Dow is lagging as investors rotate around rate sensitivity and policy uncertainty. That split underscores how the latest leg higher in yields is hitting cyclical and dividend-heavy blue chips more directly than growth-heavy benchmarks.
In foreign exchange, EUR/JPY is consolidating after a run to a 2 1/2-month high, with the pair struggling to extend beyond last week’s ¥181.55 peak. A break above that level, and ideally the May high at ¥182.05, would reopen ¥183.17, while support sits around ¥179.54 to ¥179.38.
The euro’s broader backdrop remains fragile even as the pair trades elevated, with Adalytica’s euro signal flashing “Extreme Fear” and the dollar holding near multi-week highs against major peers. That leaves EUR/JPY increasingly driven by the relative stance of the Bank of Japan and the European Central Bank, rather than by simple dollar weakness.
US natural gas futures are the clearest upside outlier, gapping above resistance at $2.857-$2.860 and printing a 2 1/2-month high at $2.90, just below the 200-day moving average near $2.924. A further push through that area would bring the psychologically important $3 level into view, while the old breakout zone near $2.857-$2.860 should now act as support.
For investors, the setup argues for continued rotation between rate-sensitive equities, currency crosses and energy contracts as traders reassess the Fed outlook and risk appetite. The next catalyst is likely to come from fresh US policy data, another batch of Fed commentary and whether the Dow can hold above its key July and September support levels.
| Entity | Gains | Losses |
|---|---|---|
| US Treasury bears | ▲Higher yields, stronger rate expectations | ▼Bond prices |
| USD bulls | ▲Two-month high, firmer policy backdrop | ▼Euro and sterling holders |
| EUR/JPY longs | ▲Still above key medium-term support | ▼Traders betting on a deeper pullback |
| US natural gas bulls | ▲Breakout above resistance, 2 1/2-month high | ▼Short sellers near $2.90 |