Gold prices fell on Aug. 18 after a sharp rally that had pushed the metal into overbought territory, with higher U.S. Treasury yields and signs of cooling demand prompting traders to lock in profits. The pullback matters because gold’s recent surge had been built on expectations of easier monetary policy and a softer dollar; a rebound in yields is now challenging that view and forcing investors to reassess how much easing is already priced in.
Gold falls as Treasury yields rise

The benchmark 10-year Treasury yield has edged up to 4.694%, after rising from 4.63% on Aug. 13, extending a move that has made non-yielding bullion less attractive at the margin. Gold futures settled at $4,397 an ounce on Aug. 18, down from $4,417.8 the previous day, while the SPDR Gold Shares ETF slipped to $398.55 from $405.49. The retreat came after a run that had left gold technically stretched, with the ETF’s relative strength index still elevated at 70.3 and gold futures at 78.5, levels that typically suggest the market has become overbought.
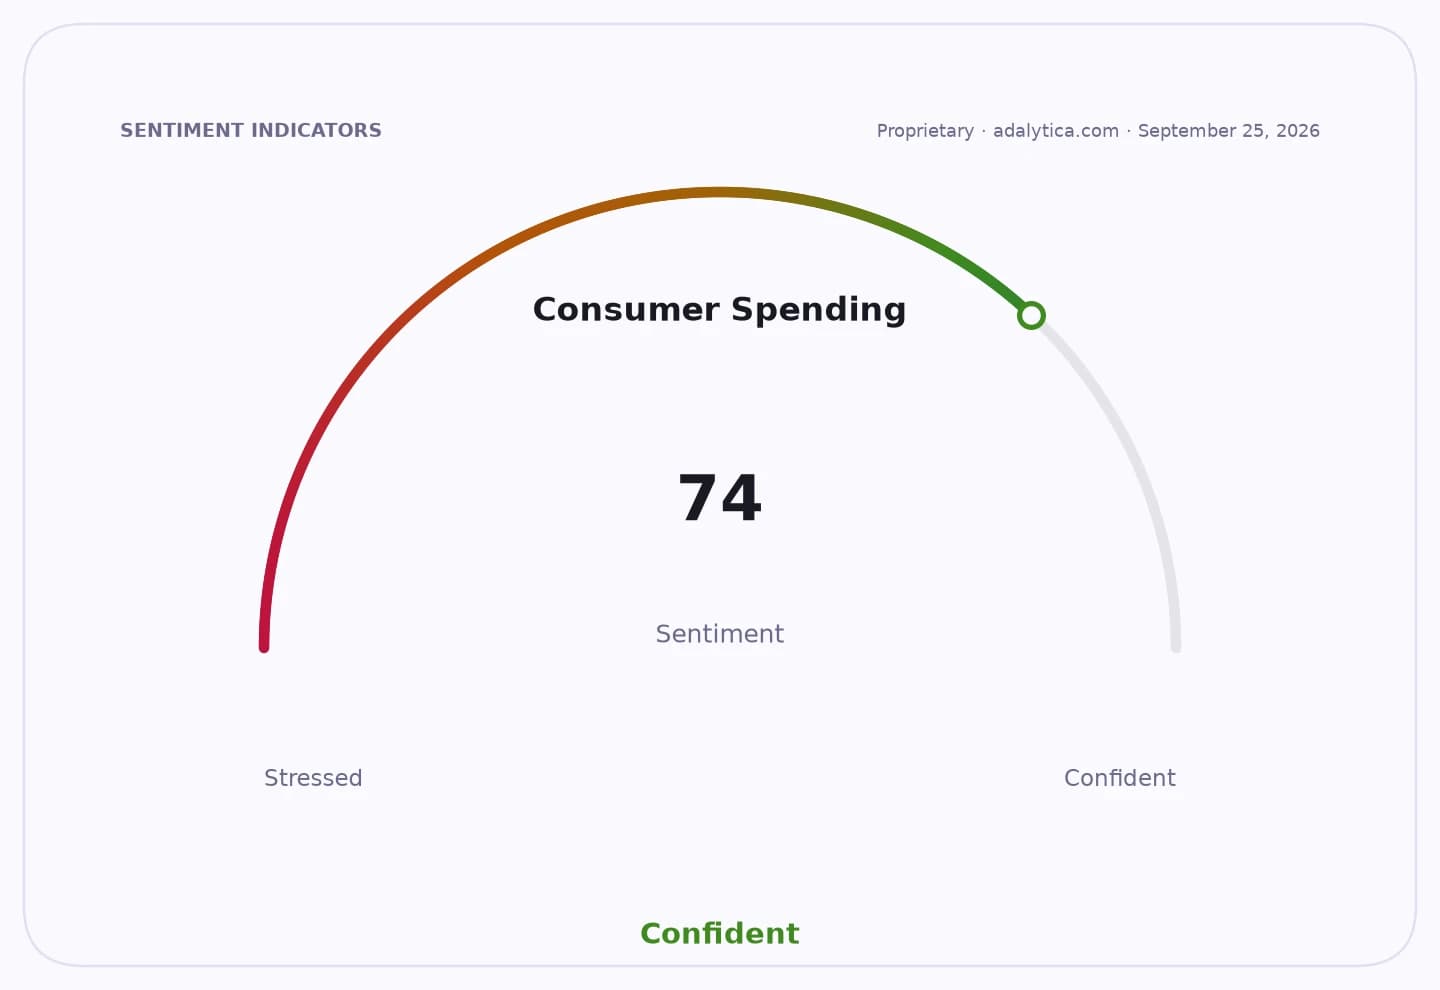
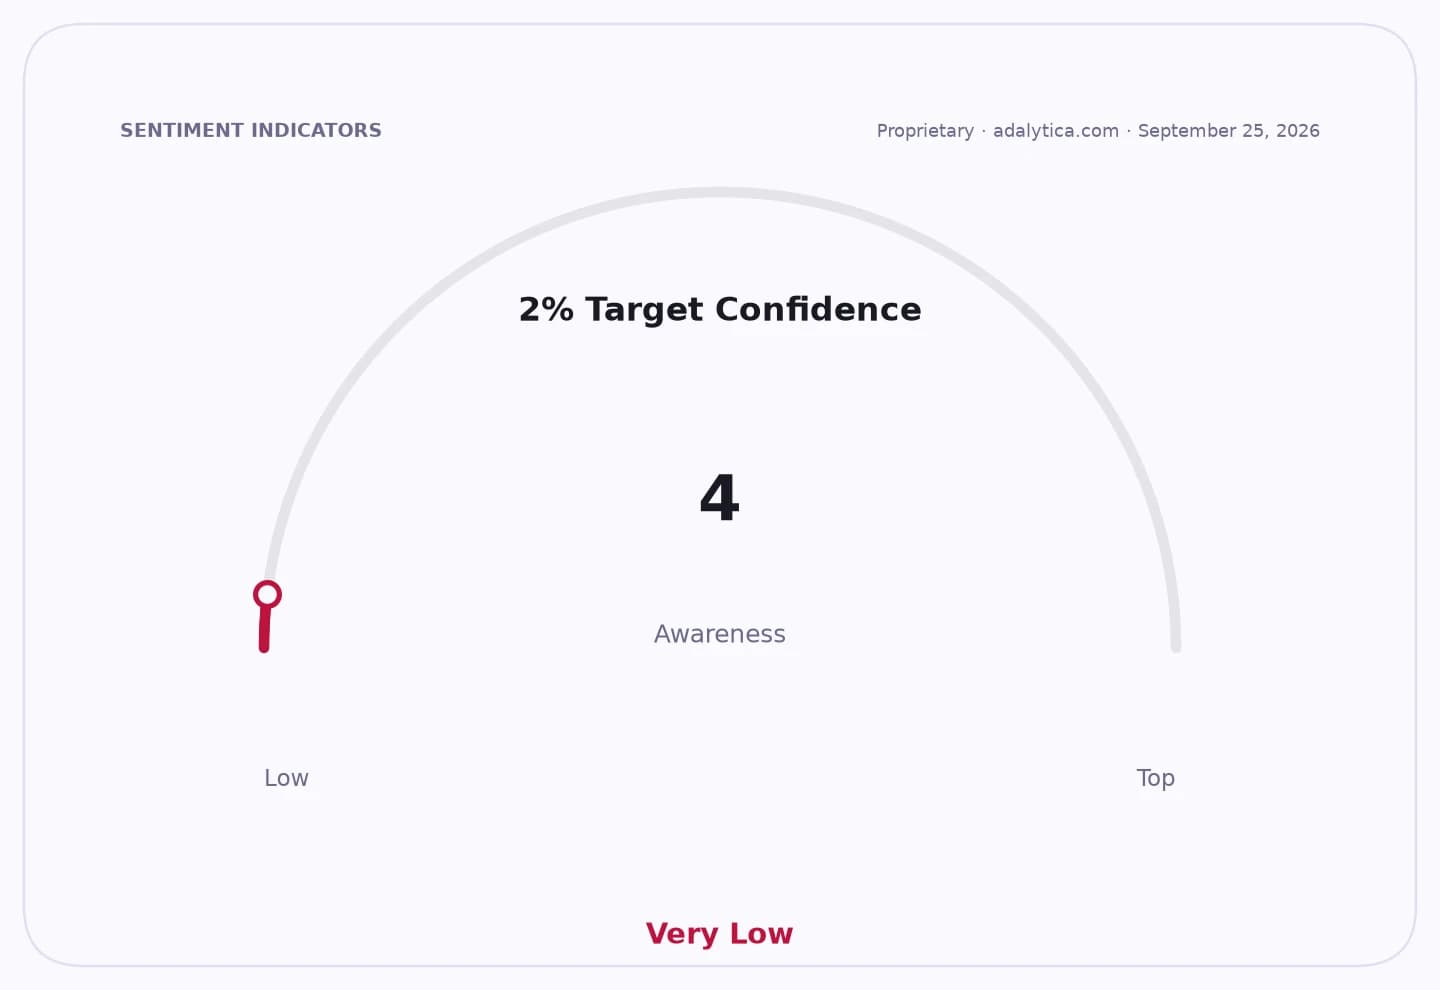
Sentiment IndicatorsⓘProprietary · adalytica.com · August 19, 2026
This is a snapshot — live sentiment, awareness and momentum for 130+ markets update continuously in the dashboard.Open AlphaPulse
The move is important economically because gold often trades as a hedge against inflation, policy uncertainty and financial stress. When yields rise, the opportunity cost of holding bullion increases; when they fall, gold tends to draw demand. The latest price action suggests that the market is becoming more sensitive to the path of rates than to the broad “risk-off” narrative that had supported the rally earlier in the year. That leaves gold vulnerable to any further increase in real rates, even if the broader macro backdrop remains unsettled.
Investor positioning also looks more fragile. Adalytica’s Gold Fear & Greed Index for GLD fell to 64 from 70 a day earlier and 74 two days earlier, a quick cooling in sentiment even though the reading remains in neutral territory. The drop in sentiment alongside the price pullback suggests momentum buyers are stepping back as the market loses some of the euphoric tone seen in recent sessions. By contrast, the long-term trend remains constructive: GLD is still above both its 50-day moving average and its 200-day moving average, indicating the larger uptrend has not been broken.
Still, the short-term chart looks less forgiving. GLD closed at $398.55 on Aug. 18, above its 50-day moving average of $381.23 but below the recent peak near $405.49, while gold futures remain well above the 50-day average at $4,158.05 and just under their $4,520.82 upper Bollinger Band. That mix points to consolidation rather than a full reversal, but it also shows how quickly profits can be taken when a crowded trade meets firmer bond yields.
For investors, the key question is whether this is a pause in a secular bull market or the start of a deeper correction. Bulls will argue that central-bank buying, persistent geopolitical risk and expectations for eventual easing still favor gold on a medium-term view. Bears will point to rising yields, stretched technicals and a fading surge in sentiment as signs that near-term upside may be limited. The next catalyst is likely to be any fresh move in Treasury yields and rate-cut expectations, which will help determine whether gold’s pullback remains orderly or turns into a broader unwind.
| Entity | Gains | Losses |
|---|---|---|
| Treasury bulls | ▲Higher yield support | ▼Gold investors |
| Gold bears | ▲Lower bullion prices | ▼Momentum longs |
| GLD holders | ▲Longer-term uptrend intact | ▼Near-term overbought trade |
| Importers of gold | ▲Cheaper metal | ▼Miners and bullion sellers |