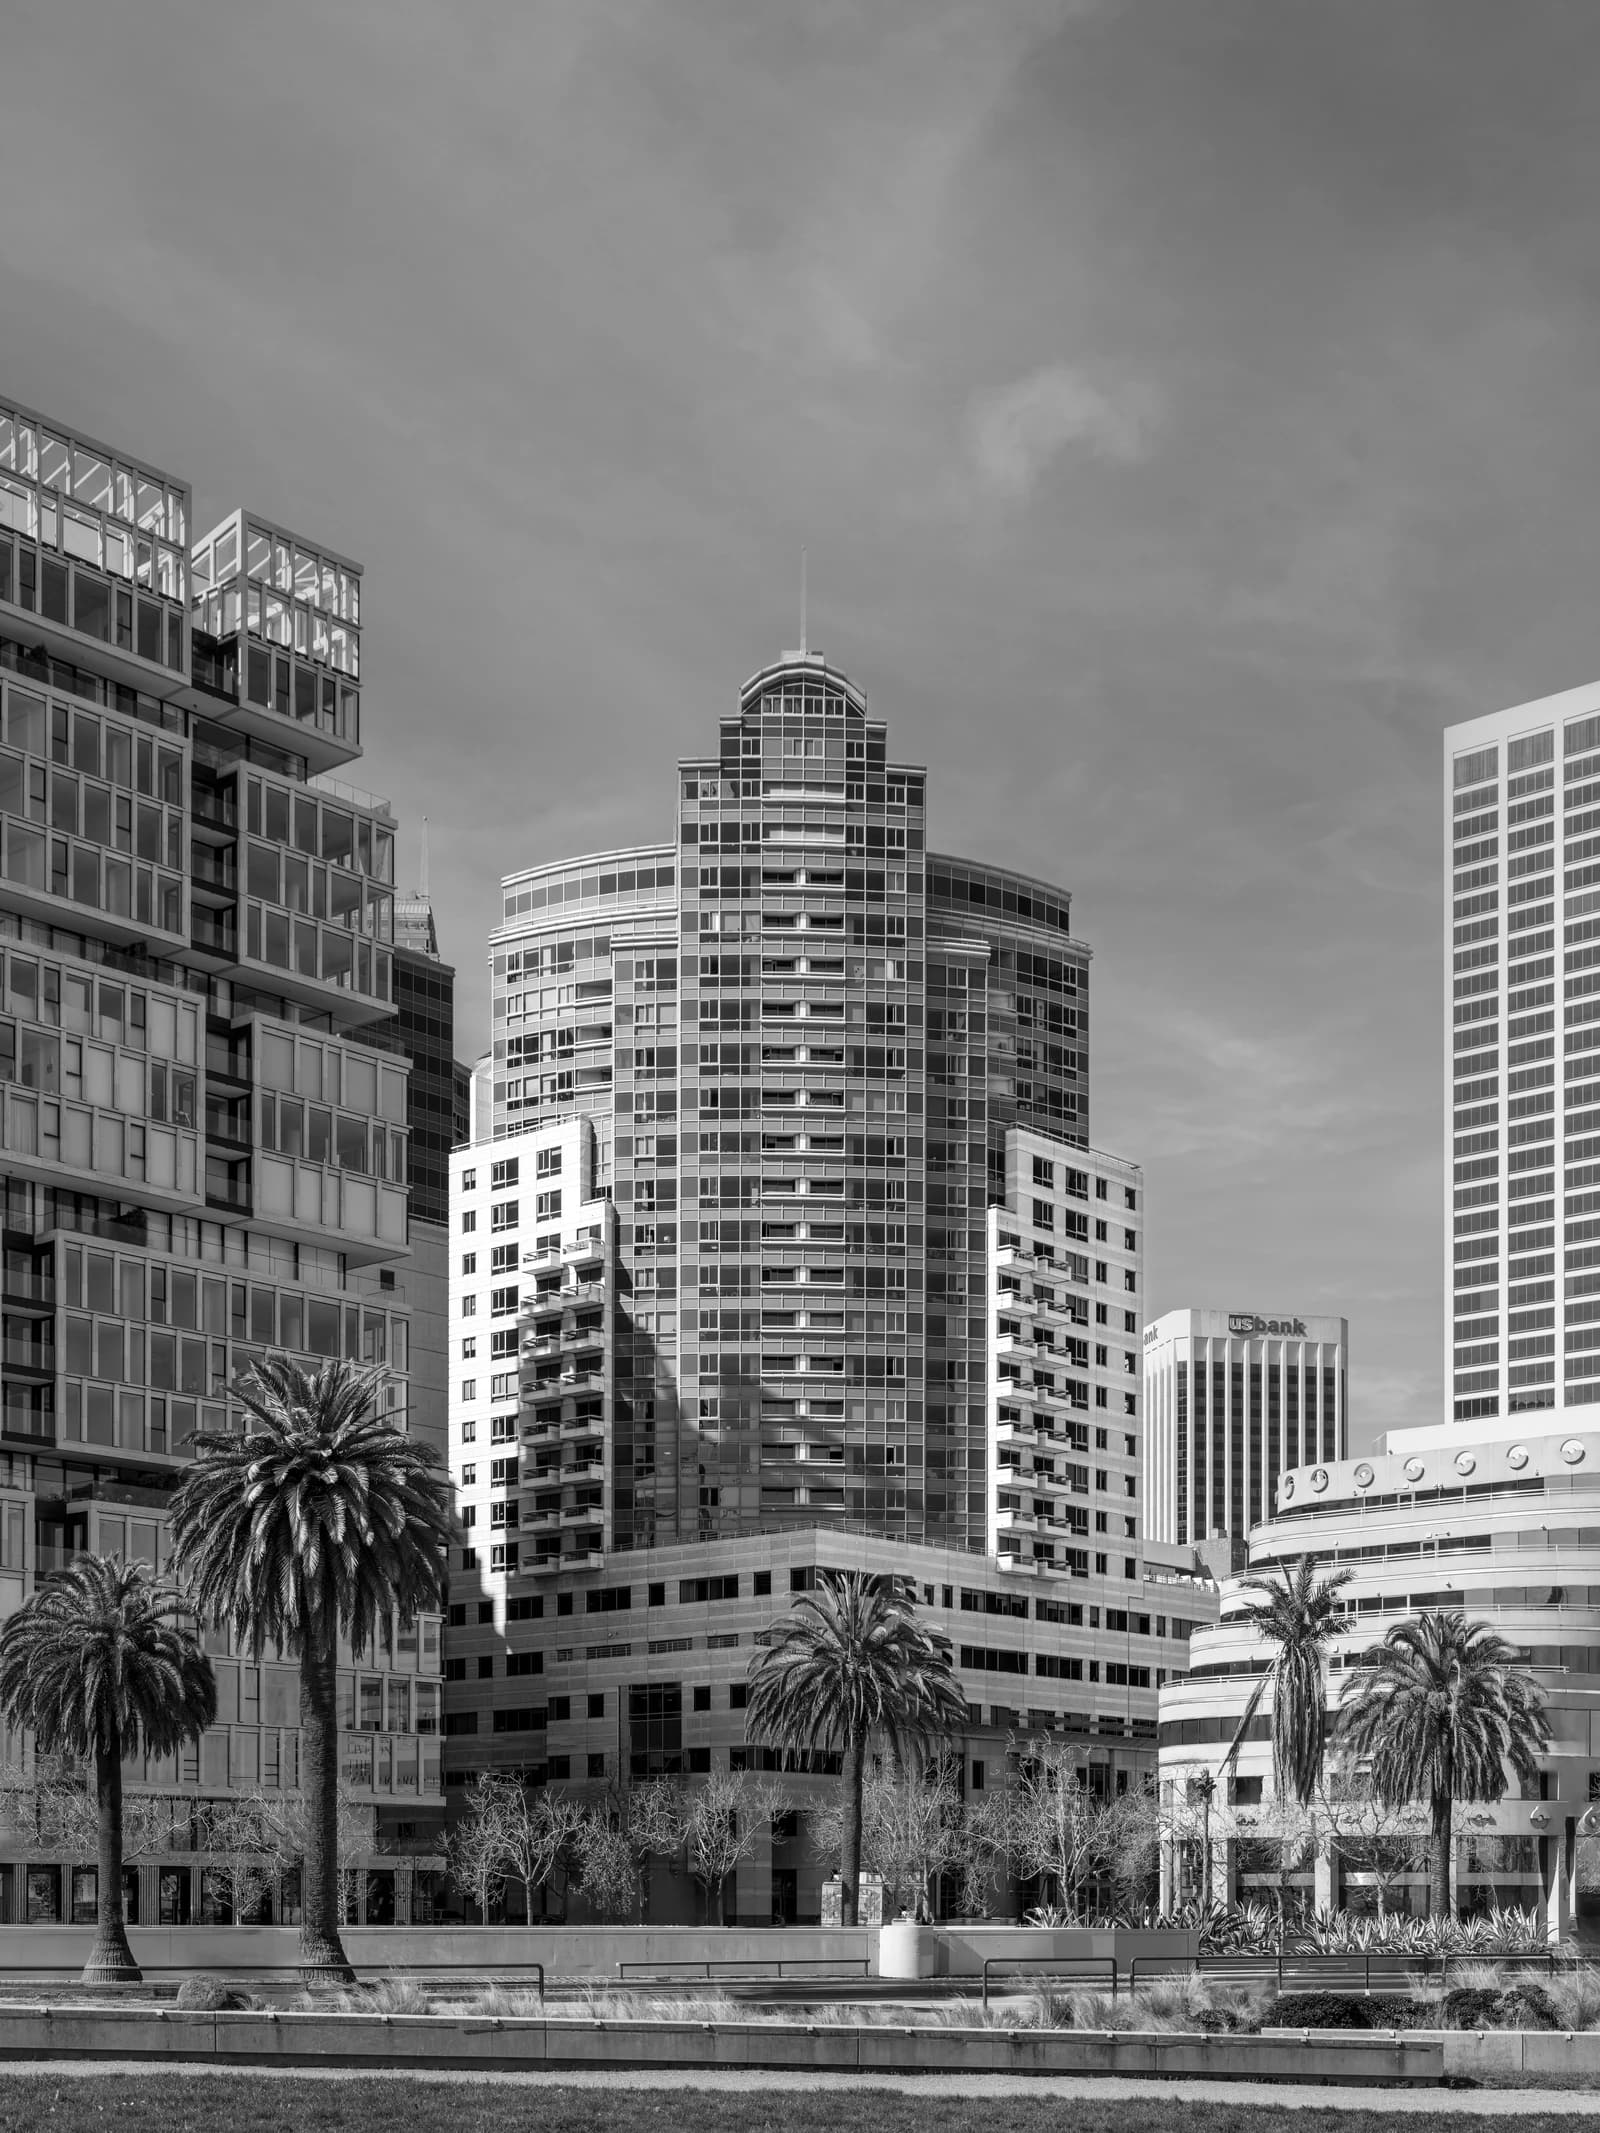
A three-bedroom house in San Jose sold for $1.103 million, underscoring how tightly priced Bay Area housing remains even as broader U.S. mortgage rates hover near 5%.
San Jose home sells for $1.103 million
The 1,408-square-foot home on Gainsville Ave. changed hands Sept. 16 at about $783 a square foot, according to public records. Built in 1964 on a 5,150-square-foot lot, the two-story house has two bathrooms, a heating system and a parking spot.
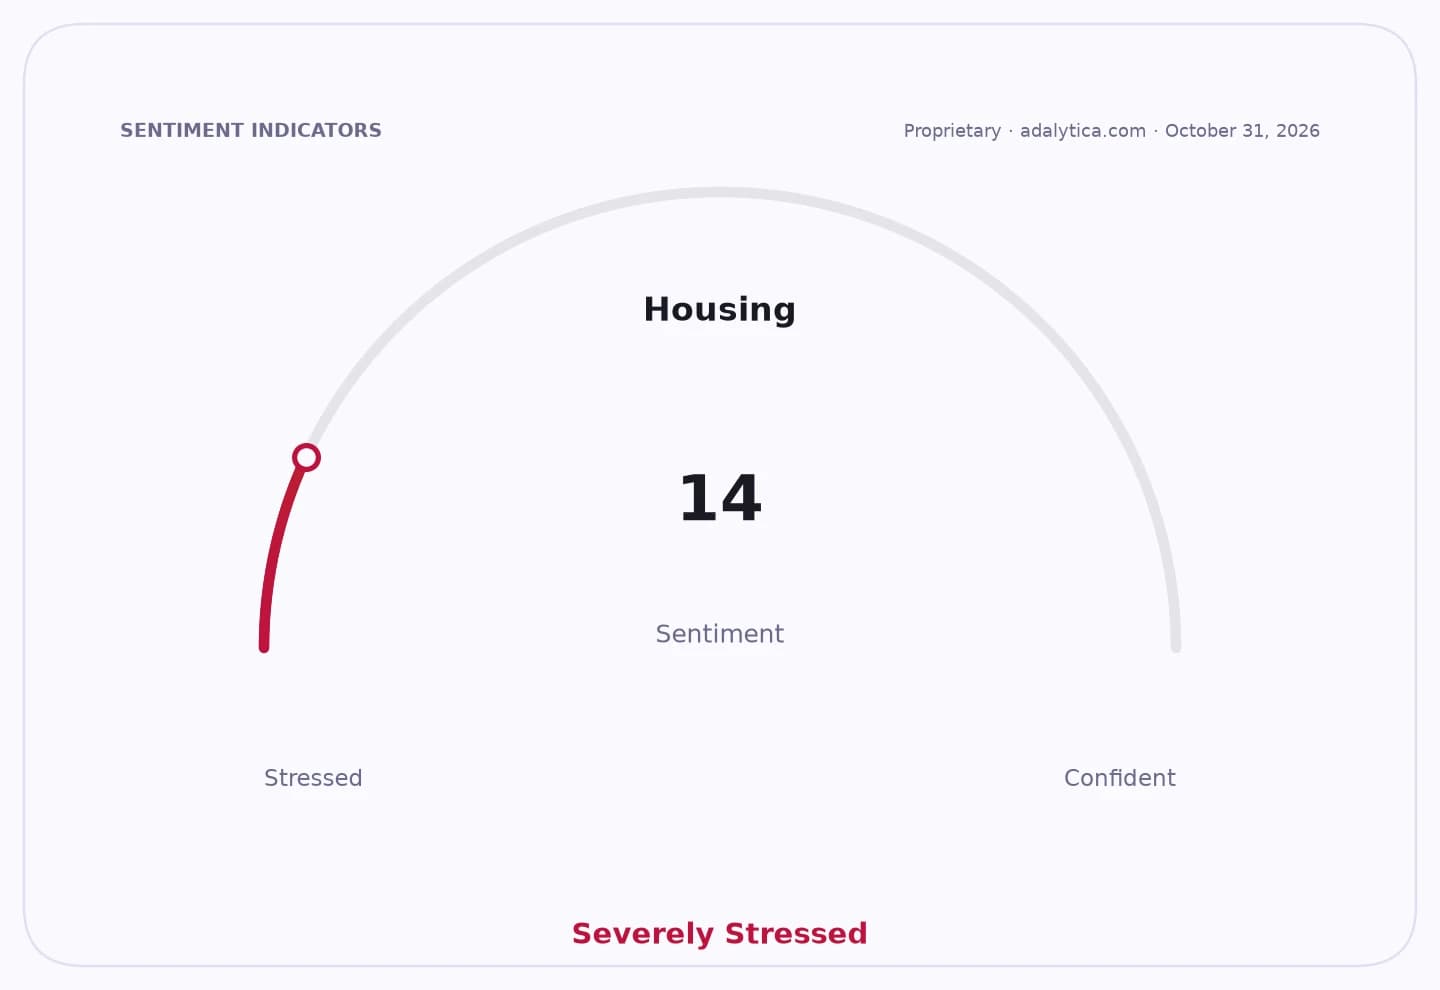
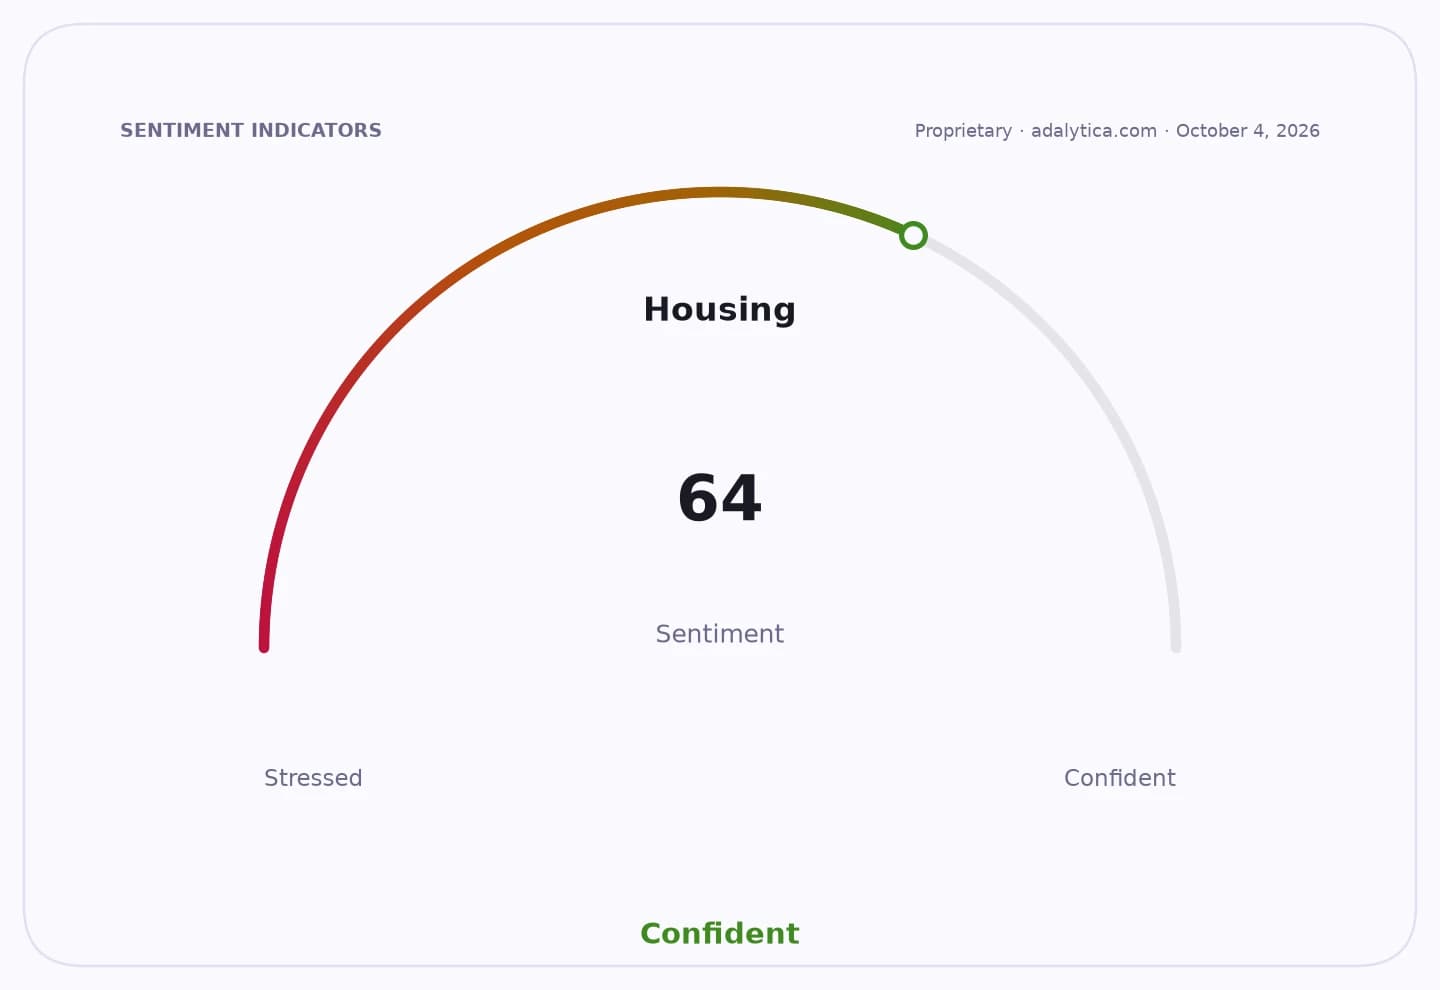
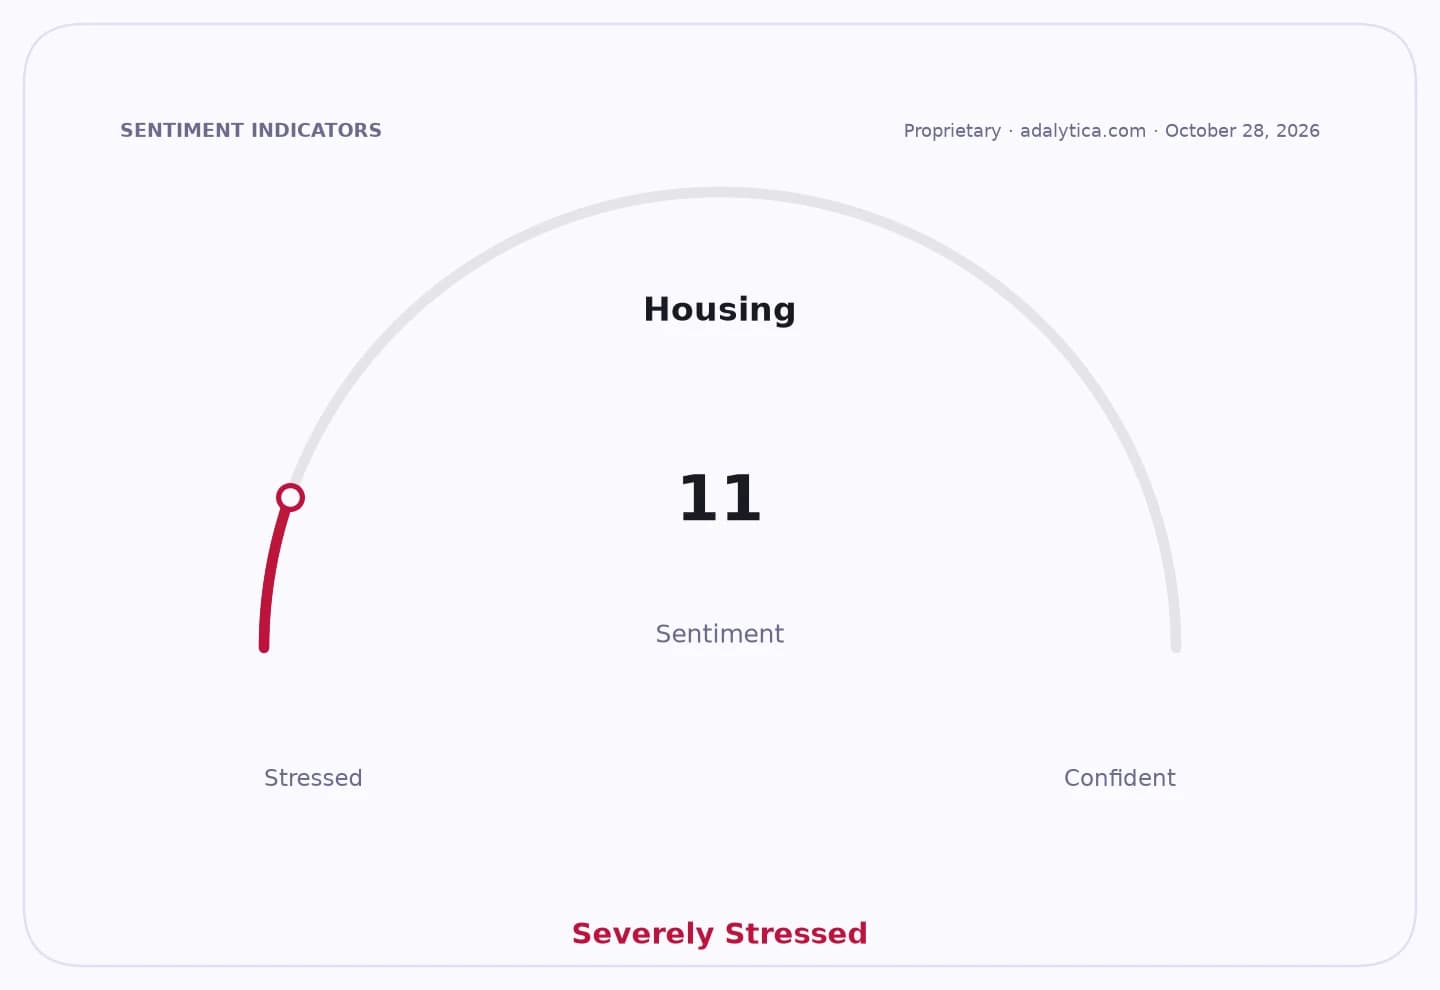
Sentiment Indicators
The sale sits between recent nearby transactions that show how uneven the San Jose market can be block to block. A 1,391-square-foot home on Karl Street sold in February for $930,000, or $669 a square foot, while a 1,141-square-foot house on Sullivan Ave. fetched $1.075 million, or $942 a square foot, in July.
That pricing backdrop comes as the national U.S. housing market remains mixed. The Case-Shiller home price index points to continued annual gains, while housing starts have been volatile, reflecting a market still constrained by supply, borrowing costs and affordability pressures.
For investors, the sale is another data point on the durability of high-end West Coast home values, which support demand for homebuilder stocks, real estate services and rental operators even as affordability limits transaction volume. The latest reading on Adalytica’s Housing and Rent Inflation Sentiment gauge shows “Extreme Fear,” suggesting consumers and investors remain wary of housing costs despite still-elevated prices.
The broader takeaway is that San Jose’s resale market is still clearing at seven-figure levels for modest single-family homes, a sign that scarce inventory continues to anchor prices. Future direction will depend on mortgage rates, local supply and whether buyers keep absorbing elevated asking prices into year-end.
| Entity | Gains | Losses |
|---|---|---|
| San Jose sellers | ▲Higher resale values | ▼Harder to afford replacement homes |
| Homebuyers | ▲More inventory choices | ▼Seven-figure entry prices |
| Homebuilders / XHB, ITB | ▲Support for pricing and demand | ▼Affordability caps volume |
| Renters / Housing consumers | ▲— | ▼Persistent cost pressure |