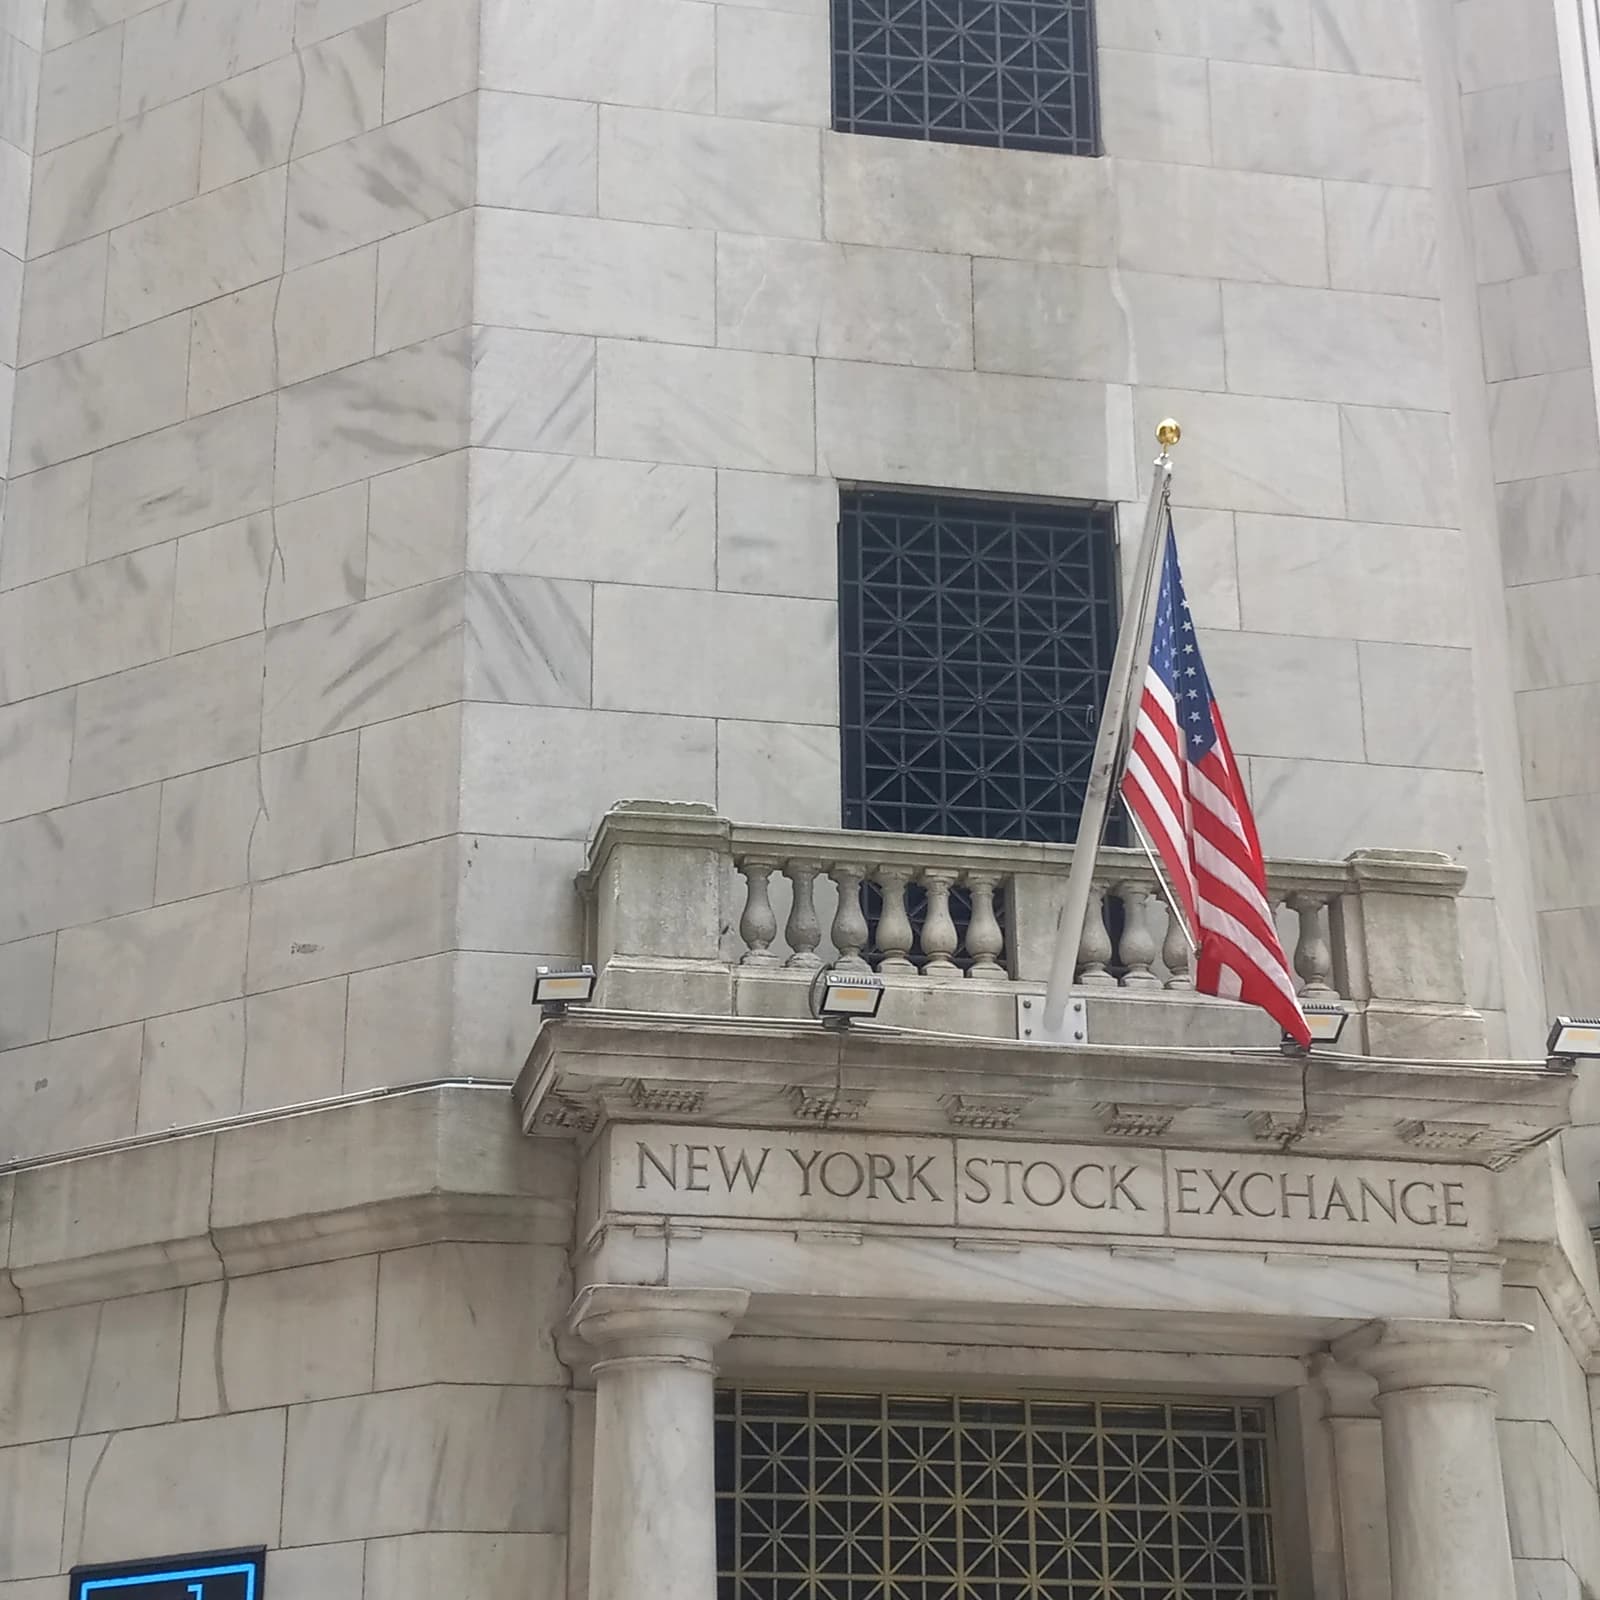
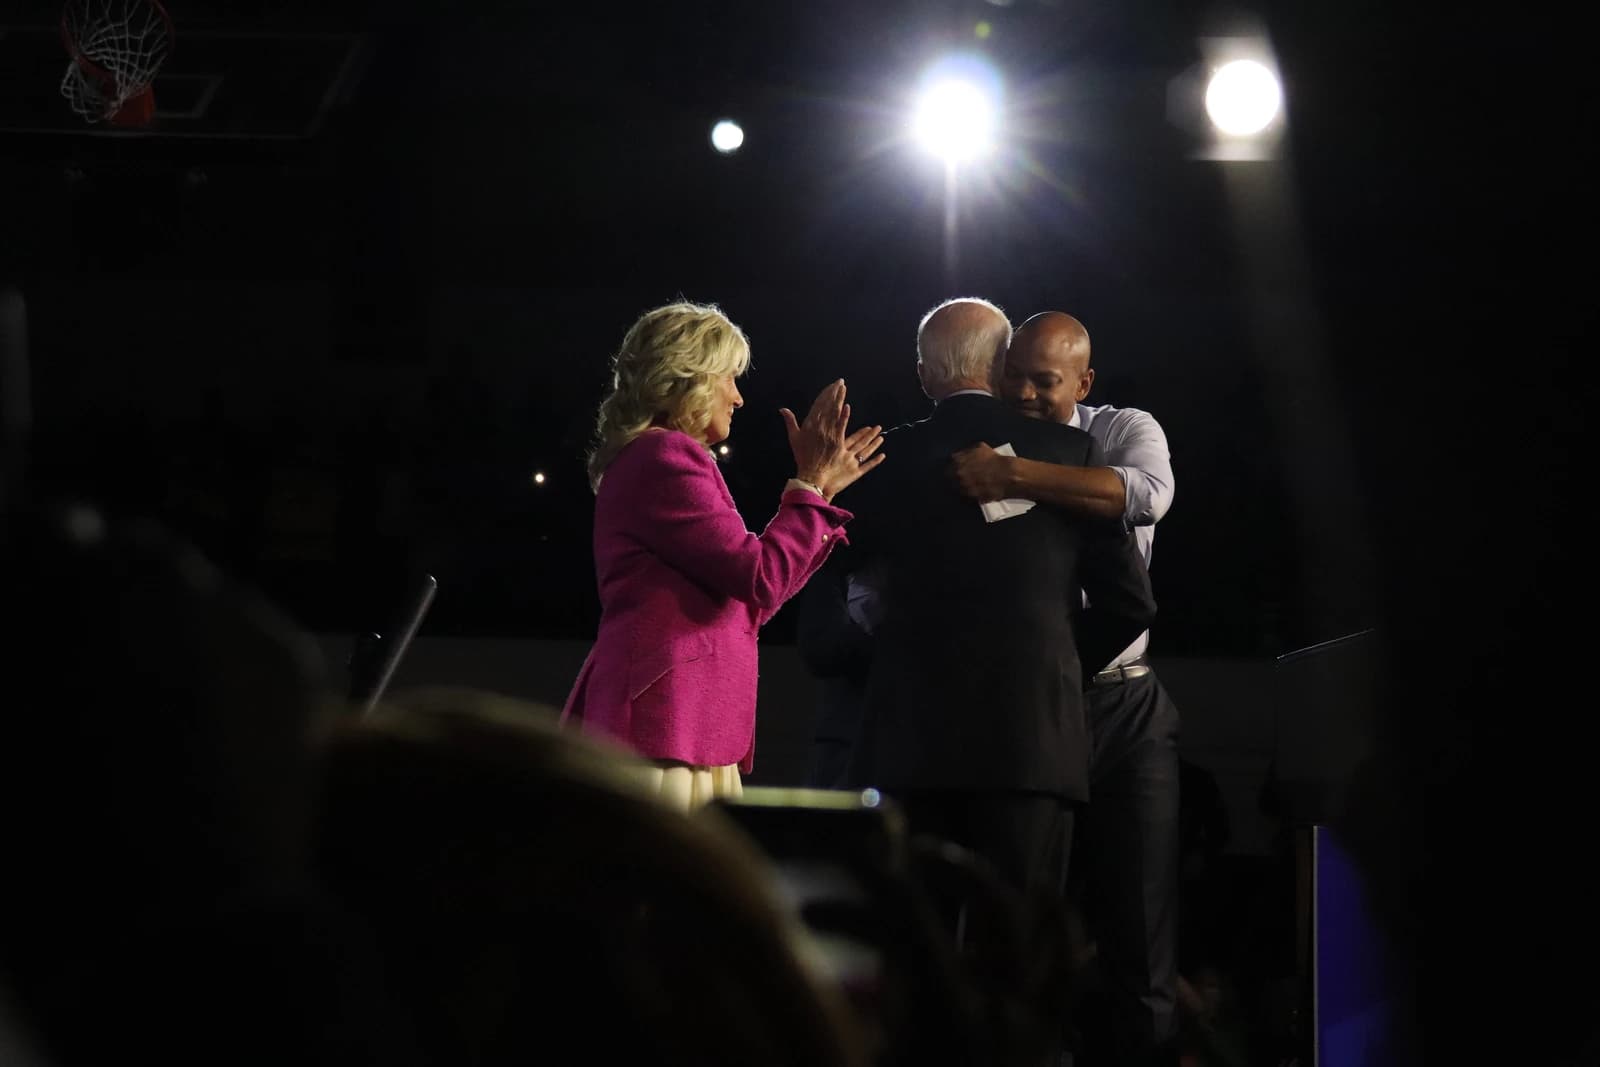
The stock market has usually done well after U.S. midterm elections, and that pattern matters because it suggests investors may be looking at political uncertainty the wrong way.
S&P 500 post-midterm gains and market history
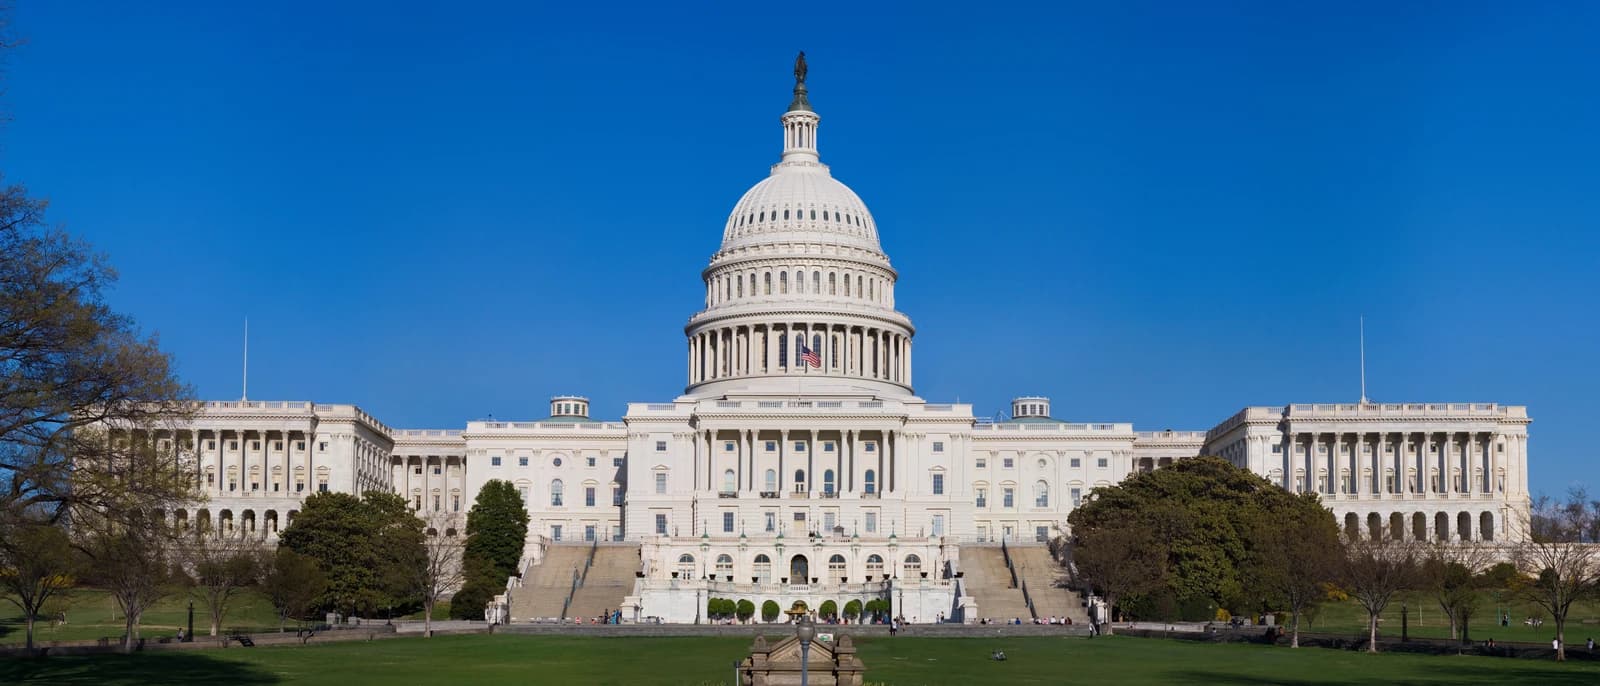
Since 1874, the S&P 500 has risen in the year after 32 of the last 38 midterm elections, with an average gain of 14%, according to a Motley Fool analysis of election-year market history. That is not a guarantee, of course, but it is a powerful reminder that markets tend to care far more about earnings, interest rates and economic growth than about which party controls Congress.

The historical pattern is even more striking when you look at the full cycle. Stocks have averaged a modest gain in the six months before a midterm election, then tended to accelerate once the vote is behind them. Across all 39 midterms since 1874, the S&P 500 has gained 12% in the 12 months after the election versus 11% for any 12-month period in its history. In the first three months after a midterm, the index has historically advanced about 4%, and it has been positive 71% of the time.
Why does that matter economically? Because it suggests that political gridlock can be a tailwind for markets once investors realize it may limit sweeping policy changes. Divided government has historically delivered stronger returns than unified control, and that makes sense: fewer surprises from Washington often means a more predictable backdrop for businesses planning capital spending, hiring and pricing. For long-term investors, predictability is usually a friend.
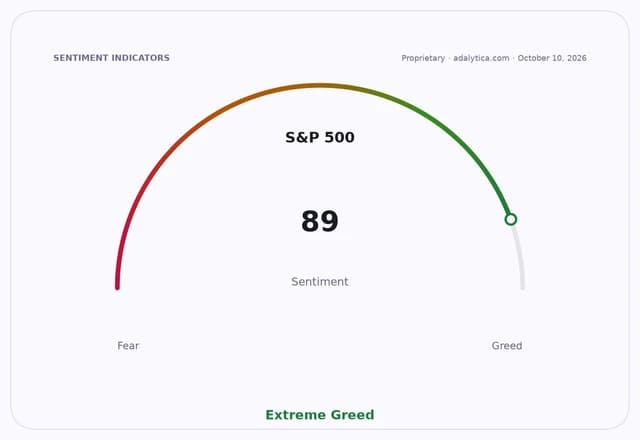
The current market backdrop reinforces that lesson. The S&P 500 has recently traded well above its 50-day moving average and its 200-day moving average, even after sharp swings earlier in the year, while RSI readings and MACD signals have reflected strong momentum rather than a market that is cheap or sleepy. Adalytica’s S&P 500 trade signals also show “Extreme Greed,” a sign that enthusiasm is high even as awareness remains subdued. That does not change the long-term midterm-election pattern, but it does mean investors should stay disciplined instead of assuming politics alone will drive returns.
Treasury bonds tell a different part of the story. TLT, a proxy for long-duration U.S. Treasurys, has been far more volatile, reflecting shifting expectations for rates and growth. That contrast is important: elections may grab the headlines, but bond prices still track inflation, Fed policy and the economy. For investors, the real question is not who wins a few seats. It is whether policy uncertainty slows the profit engine long enough to matter.
History says it usually does not. Since midterm years have often been followed by stronger stock returns, investors may be better served by using election volatility as a chance to stay invested, rebalance, and think in years rather than weeks. If anything, the lesson for long-term portfolios is simple: don’t let campaign noise distract you from the compounding power of quality businesses and a diversified portfolio.
| Entity | Gains | Losses |
|---|---|---|
| Long-term stock investors | ▲Post-midterm rallies | ▼Election-year volatility |
| Divided government | ▲Policy predictability | ▼Sweeping legislative shifts |
| Treasury-bond holders | ▲Safe-haven demand in downturns | ▼Rising-rate pressure |
| Short-term traders | ▲Price swings to trade | ▼Clear long-term signals |