U.S. Treasury yields were little changed on Wednesday, with the 2s10s curve edging to 42 basis points as secondary-market trading stayed subdued and investors kept their positions light ahead of fresh policy cues.
Treasury Curve Stays Calm as Traders Wait

That apparent calm matters because the curve is one of the clearest gauges of how bond traders are pricing growth, inflation and the Federal Reserve’s next move. A steady spread after a period of sharp swings suggests the market is not rushing to reprice the macro outlook, even though short- and intermediate-dated yields remain elevated by historical standards.
Sentiment IndicatorsⓘProprietary · adalytica.com · July 16, 2026
This is a snapshot — live sentiment, awareness and momentum for 130+ markets update continuously in the dashboard.Open AlphaPulse
The 10-year Treasury yield was forecast at 4.608%, little changed from 4.58% the previous session, while the 2-year was seen at 4.216% after closing at 4.18% on Tuesday. The widening to 42 bps from 40 bps is modest, but it keeps the curve in positive territory after a long stretch in and out of inversion, a sign traders still see some chance of slower growth or easier policy further out.
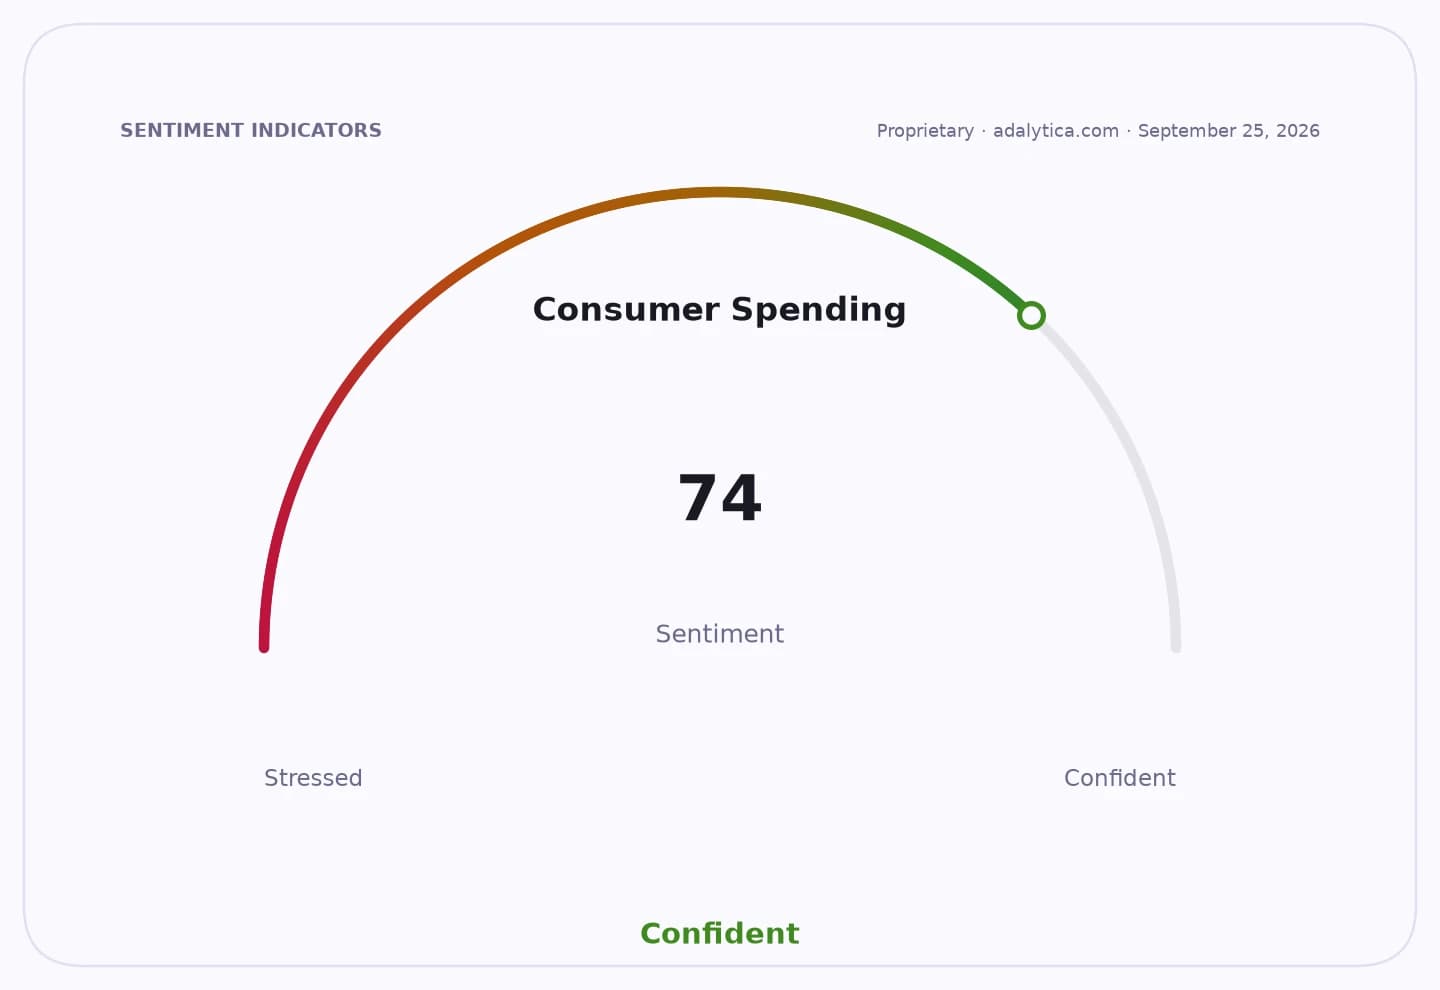
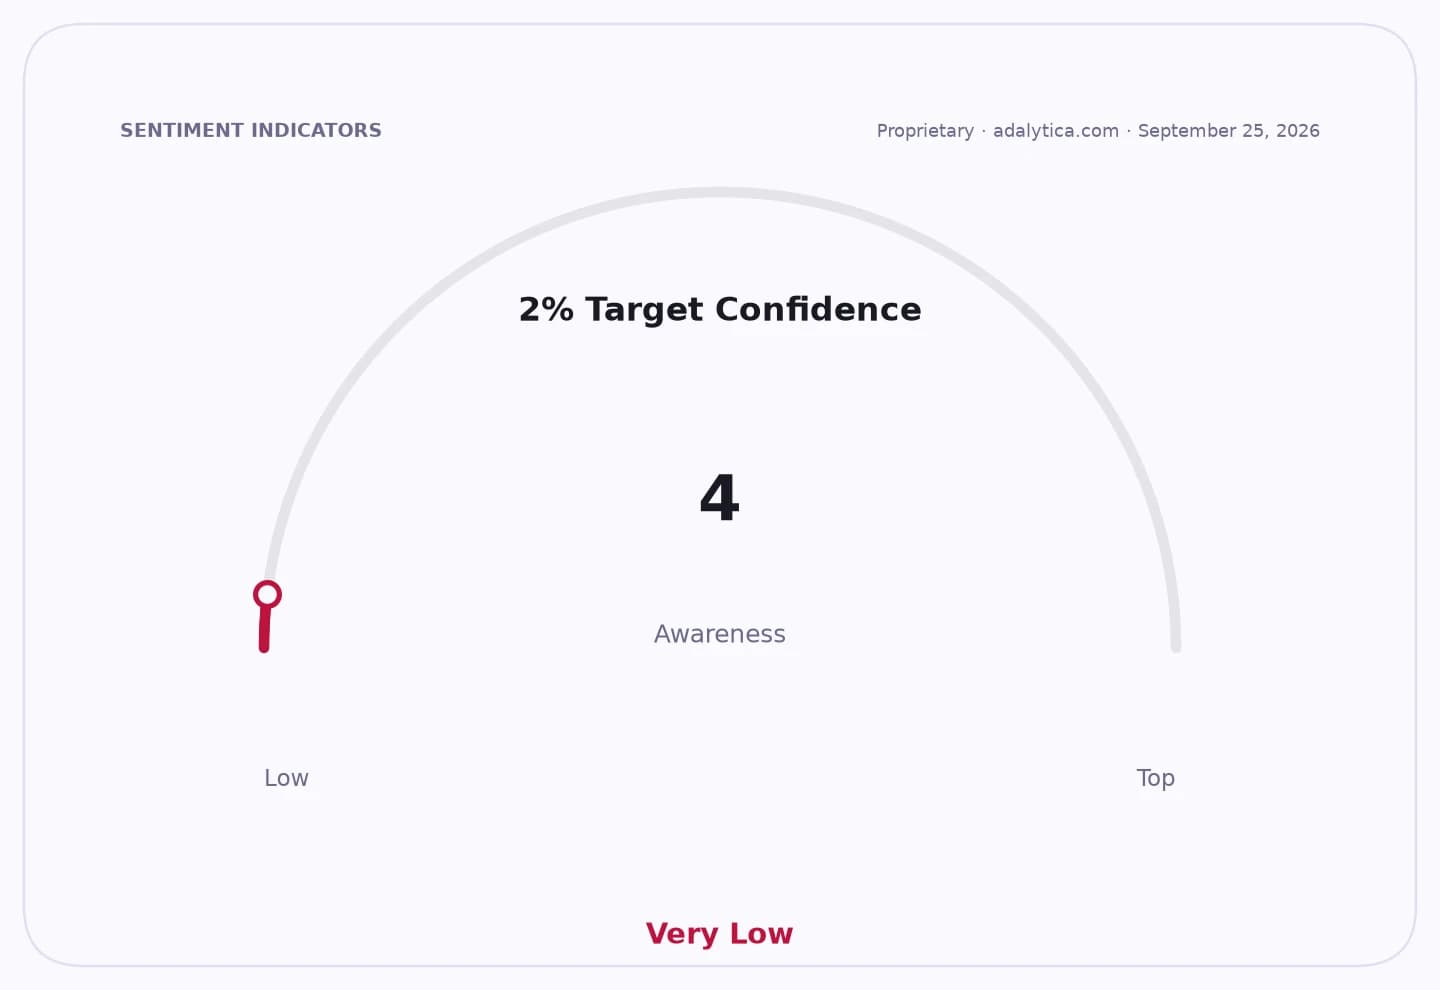
The underlying message from the market is one of caution rather than conviction. Adalytica’s market-expectations gauge for Fed rate decisions shows “Extreme Fear,” with sentiment at 15, while its Treasury trade-signal snapshot also points to “Extreme Fear” and low awareness, underscoring how little appetite there is to make aggressive directional bets. In practical terms, that usually translates into thinner liquidity, narrower trading ranges and more reliance on incoming macro data than on technical positioning.
Market Expectations vs TLTadalytica.com
Explore this data interactively — full history, time series and cross-market comparisons.Open AlphaPulse
Bond exchange-traded funds reflected the same hesitancy. TLT, the long-duration Treasury ETF, closed at $84.24 on July 15, barely above its 50-day moving average of $84.96 and still below its 200-day average of $86.04, while its RSI reading of 13.1 suggests the fund is deeply oversold on a conventional technical basis. IEF, the intermediate Treasury ETF, ended at $93.78, also slightly below its 50-day average and under its 200-day average, showing that investors remain reluctant to chase duration even after recent price stabilization. SHY, the short-duration ETF, was firmer at $82.00, a reminder that cash-like parts of the curve continue to attract demand when rate conviction is weak.
For investors, the significance is less about today’s tiny move than about what it says on positioning. A flat curve with subdued secondary activity can mean the market is waiting for a catalyst — likely inflation prints, labor data or a clearer signal from the Fed — before deciding whether long yields should drift lower on slower growth or stay anchored near current levels because policy stays restrictive for longer.
The bull case for bonds is that the curve’s stability near 40 bps still leaves room for duration gains if growth softens or the Fed turns more openly dovish. The bear case is that persistent demand for short paper and muted turnover in longer maturities reflect a market that is simply refusing to extend risk, leaving yields vulnerable to another leg higher if inflation or issuance pressures prove sticky.
For now, the yield curve is telling the same story as the quiet tape: traders are waiting, not committing, and that restraint may persist until the next data point forces the market to choose between recession risk and higher-for-longer policy.
| Entity | Gains | Losses |
|---|---|---|
| Short-duration bonds / SHY | ▲Steady demand | ▼Lower upside |
| Long-duration bonds / TLT | ▲Potential rebound if yields fall | ▼Carrying rate-risk losses |
| Treasury bulls | ▲Option value on future rally | ▼Immediate conviction remains weak |
| Treasury bears | ▲Higher yields hold firm | ▼Lack of follow-through in curve repricing |