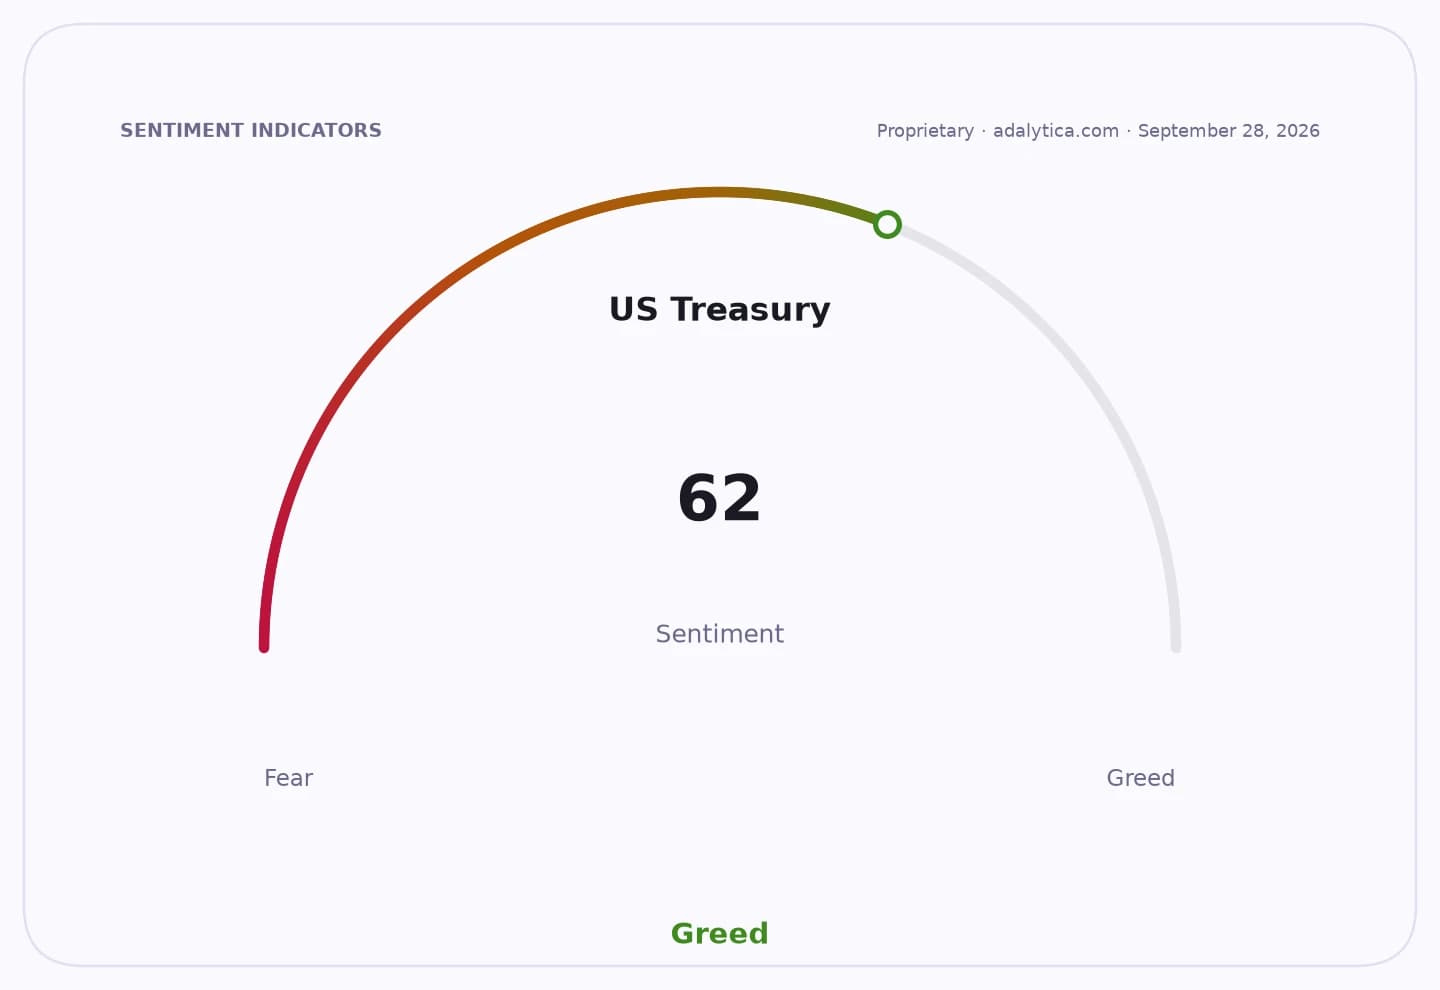
The US 10-year Treasury yield is moving toward levels last seen in 2000, and Pimco’s warning that it could hit 6% underscores how a bond selloff is threatening to reset borrowing costs across markets.
US 10-year Treasury yield nears 2000-era highs
The benchmark yield has climbed almost 120 basis points this year and recently touched 5.34%, its highest since 2002, as higher oil prices, stubborn inflation and growing concern over US public debt pushed investors to demand more compensation to own long-duration government bonds. The move matters because the 10-year Treasury is the reference rate for everything from mortgages to corporate loans, and further gains would tighten financial conditions even if the Federal Reserve pauses its rate hikes.
Sentiment IndicatorsⓘProprietary · adalytica.com · October 10, 2026
This is a snapshot — live sentiment, awareness and momentum for 130+ markets update continuously in the dashboard.Open AlphaPulse

Dan Ivascyn, Pimco’s chief investment officer, told the Financial Times that a sharp rise to 6% was “feasible” in the near term, pointing to negative technicals and stop-loss selling by hedge funds and other leveraged players. Those flows matter because Treasury markets are so deep that forced unwinding can amplify moves well beyond what macro data alone would justify. The latest surge has already pushed the 30-year yield above 5.6%, its highest since 2002, and the 10-year posted its biggest quarterly rise this century in the three months through September.
For investors, the warning is less about the exact level than the regime shift it implies. A move to 5.5% or higher, Ivascyn said, would likely bring “some decent weakness” in credit and equities. That reflects the math of valuation: as risk-free yields rise, the present value of future earnings falls, while corporate borrowers face higher refinancing costs and wider spreads if Treasury volatility persists. Long-duration assets, including growth stocks and investment-grade bonds, are especially exposed.
DGS10 vs DGS2 — macro contextadalytica.com
Explore this data interactively — full history, time series and cross-market comparisons.Open AlphaPulse
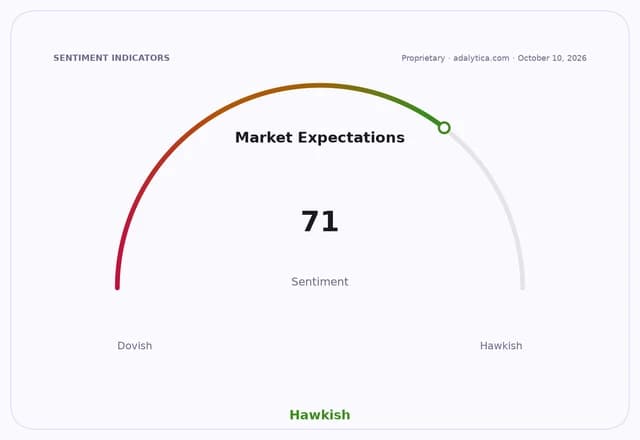
The selloff also fits a broader global backdrop in which bond yields have risen across developed markets as energy costs feed inflation fears and the AI boom supports growth expectations. The 10-year yield’s jump has lifted the US curve from earlier inversion toward a more steepened shape, with the gap between the 10-year and 2-year around 44 basis points, but that does little to ease pressure on rate-sensitive assets. Recent technical readings on Treasury ETFs such as TLT show oversold conditions, yet that can be a sign of momentum rather than capitulation in a fast-moving market.
The next test is whether inflation data and Fed rhetoric continue to validate higher-for-longer pricing, or whether the selloff begins to destabilize risk assets enough to force a reversal. For now, Pimco’s message is that the market is not merely repricing policy; it is challenging the ceiling on long-term US borrowing costs.
| Entity | Gains | Losses |
|---|---|---|
| Yield sellers / short-duration holders | ▲Higher reinvestment yields | ▼Capital losses on bonds |
| Hedge funds / leveraged bond traders | ▲Potential rebound if yields reverse | ▼Stop-outs and forced unwinds |
| Banks / new debt issuers | ▲— | ▼Higher funding and refinancing costs |
| Long-duration stocks / credit investors | ▲Higher selectivity in pricing | ▼Lower valuations and wider spreads |