Housing affordability in the U.S. remains sharply split by region, with Midwest and Sun Belt metros offering the best balance of prices, supply and construction while coastal hubs stay trapped at the bottom of a new Realtor.com ranking.
U.S. housing affordability split by region
The report, which grades the 100 largest metro areas on affordability and new-home construction, put Des Moines, Iowa, at No. 1 with an A+ and ranked Raleigh, North Carolina; Columbia, South Carolina; Houston and Indianapolis next. Los Angeles finished last with an F, followed by Providence, New York City, Honolulu and Boston.
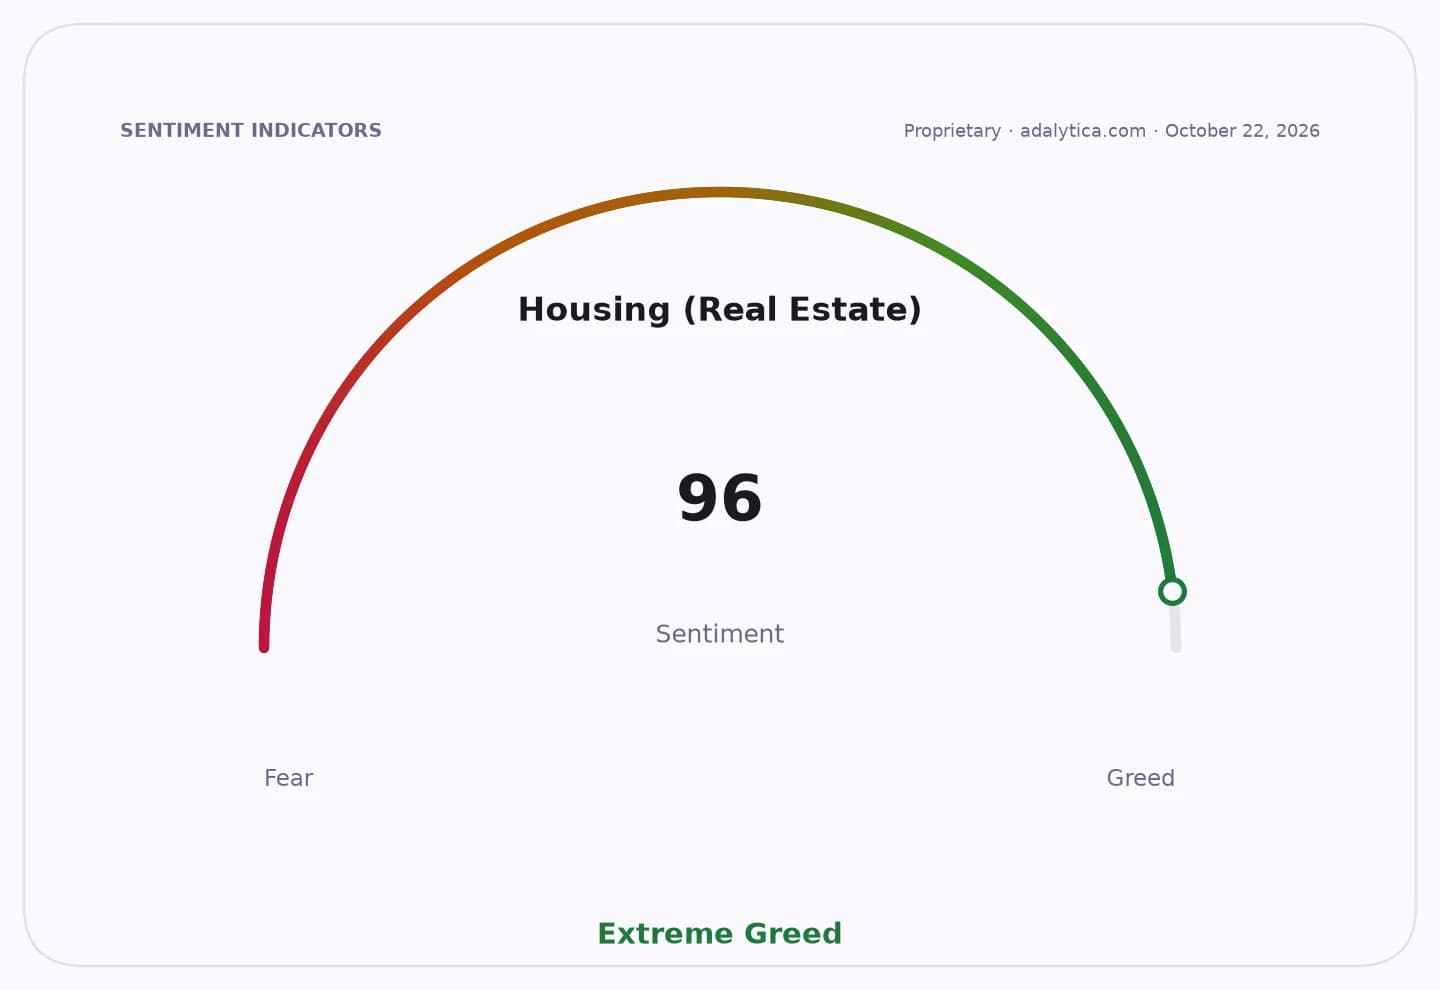
Sentiment IndicatorsⓘProprietary · adalytica.com · October 22, 2026
This is a snapshot — live sentiment, awareness and momentum for 130+ markets update continuously in the dashboard.Open AlphaPulse
The divide matters because housing is still a major inflation driver and a key constraint on household mobility, labor supply and consumer spending. Realtor.com said the U.S. remains short more than 4 million homes after years of underbuilding, leaving many buyers shut out even as demand cools under 5% mortgage rates.
Senior economist Joel Berner said the strongest markets are the ones where local officials make it easier and faster to build, with less restrictive zoning, quicker permitting and more available land. Those places are also tending to have faster job growth, letting builders add supply before affordability is completely crushed.
That dynamic is feeding directly into the homebuilding trade. Builders have been squeezed by higher materials, labor and regulatory costs while buyer traffic stays weak, forcing more incentives and mortgage-rate buydowns to move inventory. Public builders have already flagged softer pricing and margin pressure, showing up in recent filings from D.R. Horton, Lennar and NVR.
The ranking also helps explain why homebuilder ETFs have been volatile. ITB, which tracks homebuilders, and XHB, a broader homebuilders fund, have both pulled back from earlier highs and are trading below recent peaks, even as the longer-term affordability gap keeps the sector in focus. By contrast, the real estate ETF VNQ has held up more steadily, reflecting the relative resilience of income-producing property versus new-home demand.
For investors, the message is that affordability is not improving evenly enough to support a broad-based housing recovery. Markets with friendly zoning, abundant land and job growth may keep attracting builders and capital, while expensive coastal metros remain constrained by supply shortages and political resistance to density.
That sets up a continued split between beneficiary markets and those still locked out of supply growth, with mortgage rates, local zoning reform and builder incentives likely to determine which cities climb the next ranking and which remain stuck at the bottom.
| Entity | Gains | Losses |
|---|---|---|
| Midwest and Sun Belt metros | ▲More homebuilding, better affordability | ▼Less scarcity premium |
| Coastal metros | ▲— | ▼Persistent shortages, weaker affordability |
| Homebuilders | ▲Easier permits in growth markets | ▼Margin pressure from incentives |
| Buyers in top-ranked metros | ▲Lower relative prices | ▼— |