BNB is drawing exceptional trading interest, but the token’s failure to stay well above $600 suggests the latest wave of volume has done more to intensify price discovery than to confirm a durable breakout.
BNB tests $600 after $1.47 billion volume jump
The token rose to $607.36 on Aug. 9, after a $1.47 billion one-day jump in activity, yet it remains just under the psychologically important $600 mark on a sustained basis and still well below its recent highs above $1,000. That gap matters because BNB is now trading in a market where participation is surging but conviction is not, a combination that often precedes either a sharp trend continuation or a fast unwind.
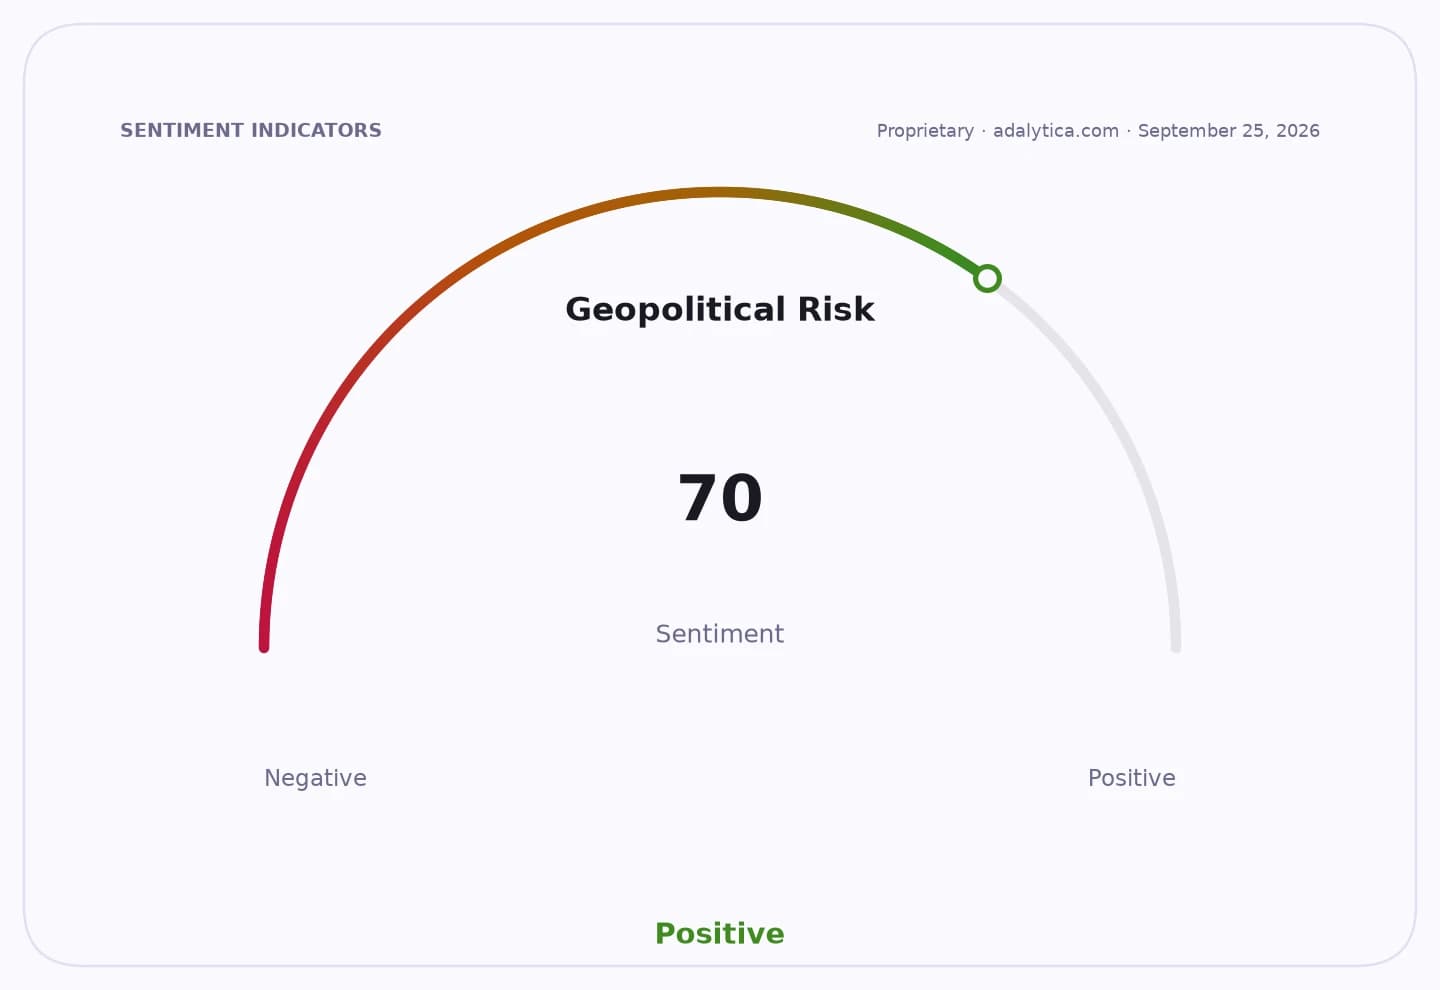
Sentiment IndicatorsⓘProprietary · adalytica.com · August 9, 2026
This is a snapshot — live sentiment, awareness and momentum for 130+ markets update continuously in the dashboard.Open AlphaPulse
The move comes against a broader backdrop of elevated stress in digital assets. Bitcoin is changing hands around $65,086, far below its 50-day average near $63,322 but with momentum still fragile after a deep selloff earlier this year. Adalytica’s Bitcoin Fear & Greed Index shows “Extreme Fear” at 12, even as awareness remains at 100, underscoring how active the market is despite weak risk appetite. In that setting, BNB’s ability to attract heavy turnover is notable, but the price action indicates sellers are still using strength to reduce exposure.
Technicals are mixed. BNB’s close above both its 50-day and 200-day moving averages, at $574.70 and $629.62 respectively, shows the token has recovered from its February slump around $606, when the relative strength index collapsed to 14.4 and the market briefly looked oversold. But the latest RSI reading of 68.7 suggests the rebound has rebuilt momentum into overbought territory, while the MACD remains positive. That supports the bull case for further upside if buyers can keep absorbing supply near $600. The bear case is that the token is running into resistance just as broader crypto sentiment is still poor, leaving it vulnerable to a retracement if volume fades.
For investors, the significance is less about one day’s tape and more about what it says about liquidity in the BNB complex. High turnover can attract momentum traders and improve price discovery, but it also raises the risk of sharp reversals when positioning gets crowded. If BNB can hold above $600 and reclaim its 200-day average, it would strengthen the case that the market is rotating back toward higher-beta crypto assets. If not, the latest surge in activity may end up looking like distribution rather than accumulation.
The next test is whether turnover stays elevated while price holds near this level. A clean break above the upper Bollinger Band area around $607.44 would suggest the market is willing to pay up for BNB again. Failure there would leave the token exposed to a quick move back toward the mid-$500s, where the 50-day average still offers first support.
| Entity | Gains | Losses |
|---|---|---|
| BNB bulls | ▲Momentum breakout case | ▼Chasing at resistance |
| BNB bears | ▲Re-entry on failed breakout | ▼Short squeeze risk |
| Active traders | ▲Volatility and liquidity | ▼Directional whipsaws |
| Broader crypto market | ▲Renewed risk appetite if BNB holds | ▼Confidence if BNB rejects $600 |