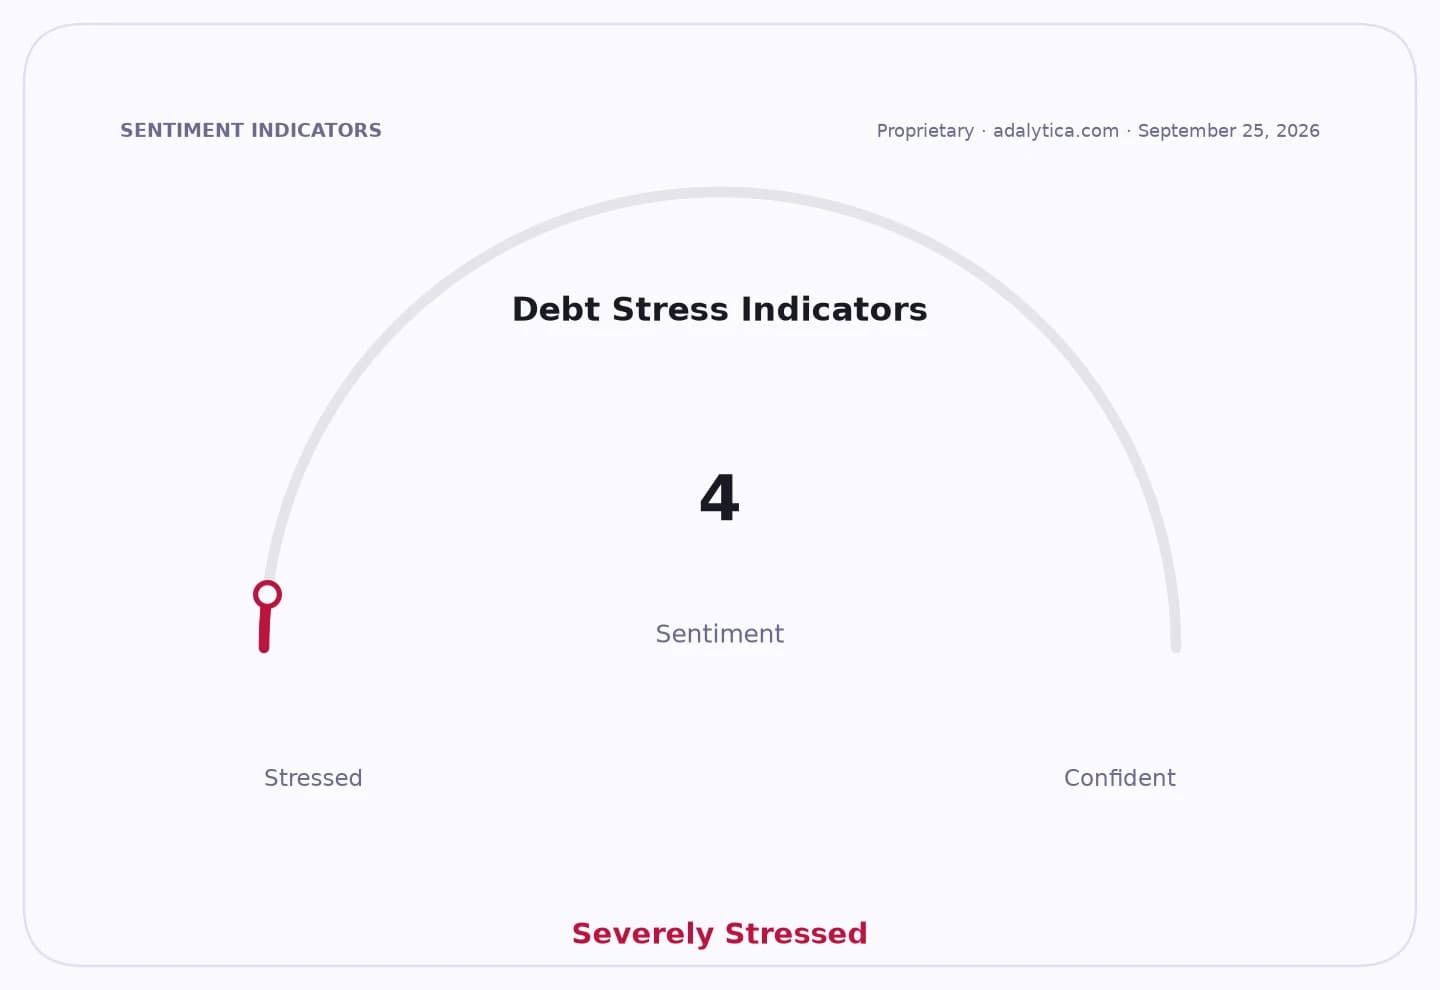
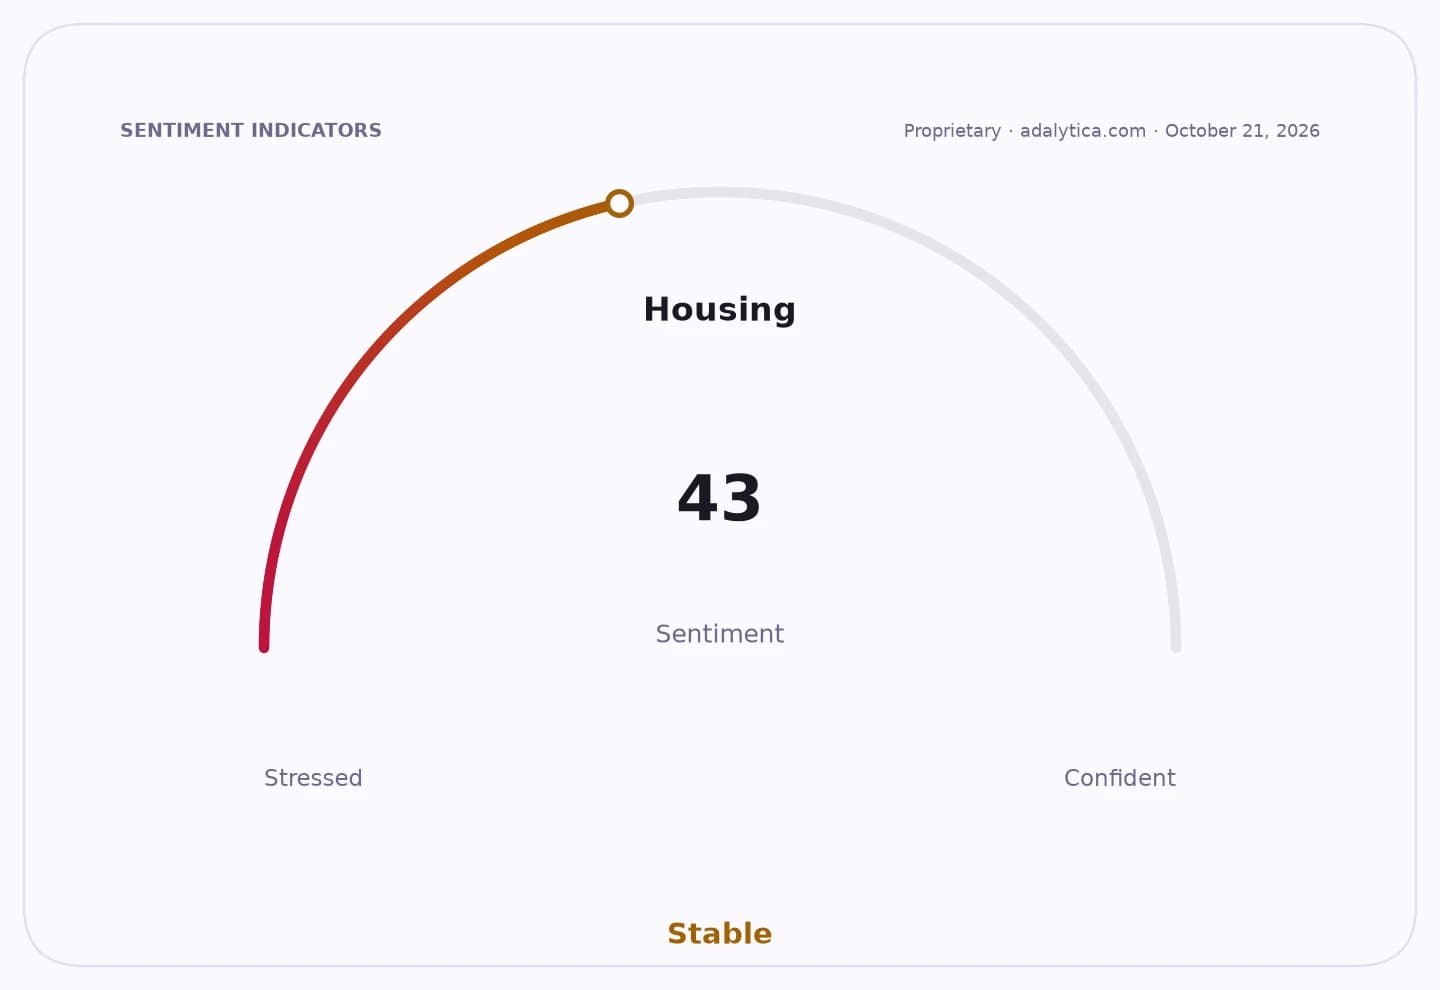
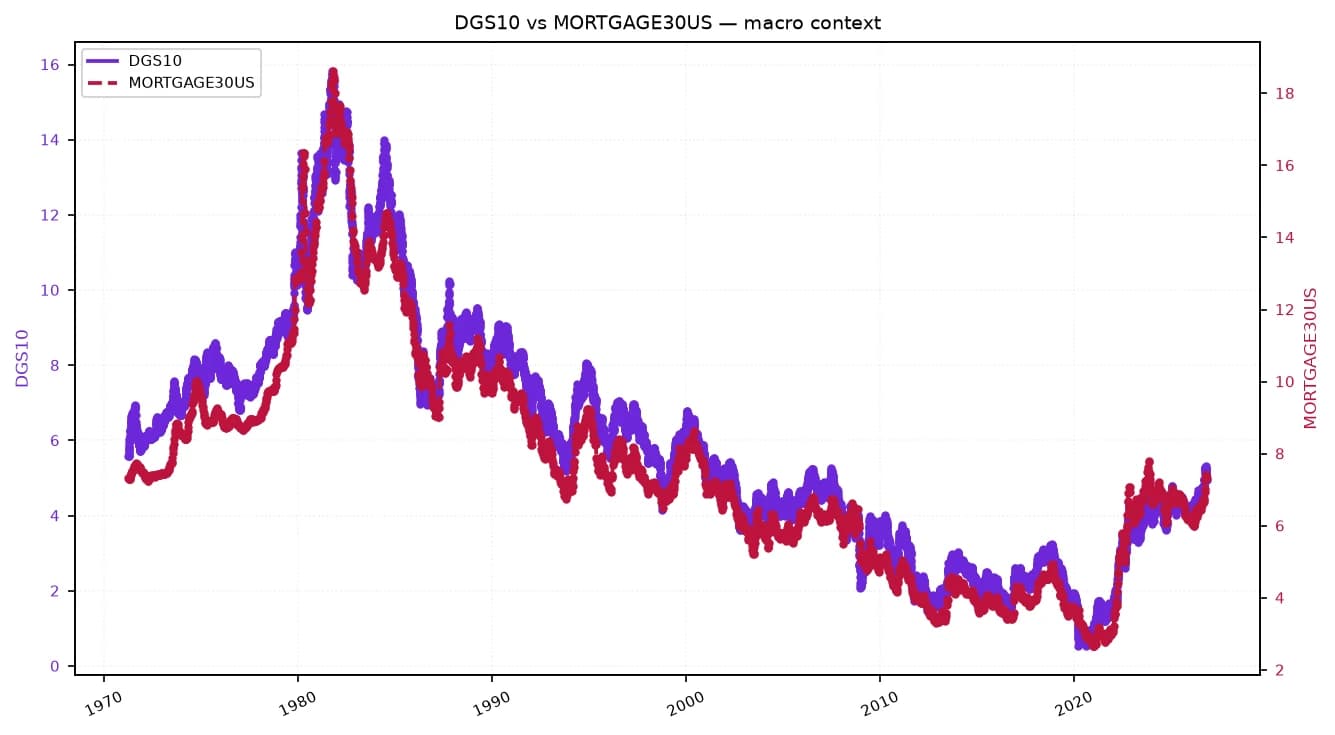
Higher borrowing costs and still-elevated debt burdens are tightening the gate for would-be homebuyers, making debt-to-income ratios more important than at any point since the post-pandemic housing boom began to cool.
Debt-to-income pressure weighs on U.S. homebuyers
For readers of The Carr Report, the calculation is simple but the stakes are not. Lenders use debt-to-income, or DTI, to measure how much of a borrower’s monthly income is already spoken for by debt payments. In a market where mortgage rates remain materially above the ultra-low levels of 2020-21, that ratio now determines not just whether a household can qualify for a loan, but how much house it can realistically afford.
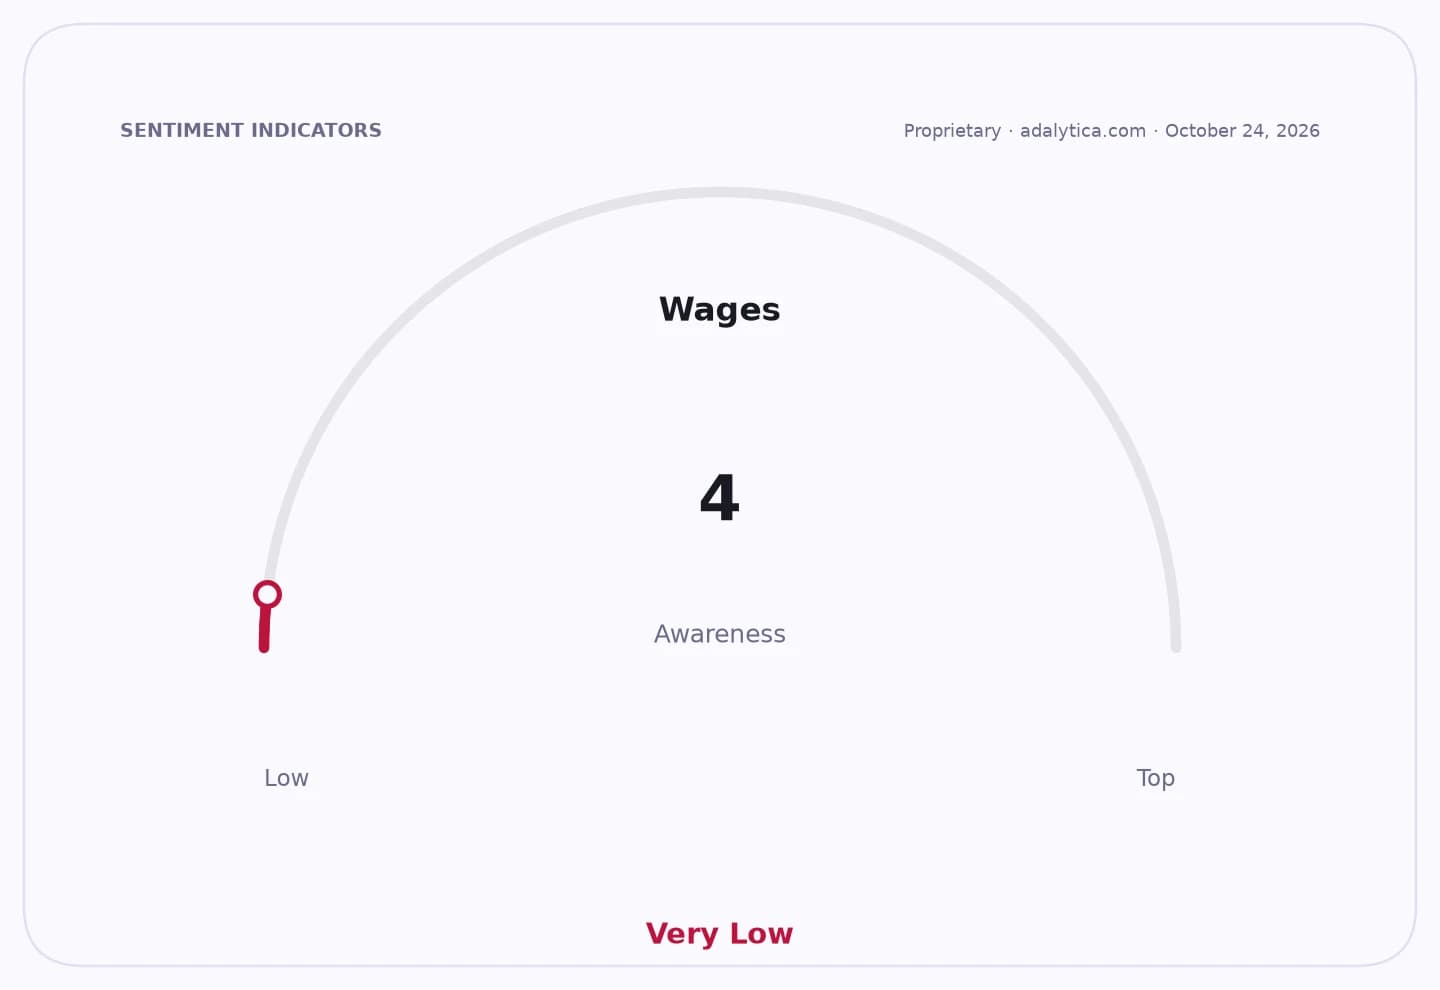
Sentiment IndicatorsⓘProprietary · adalytica.com · October 24, 2026
This is a snapshot — live sentiment, awareness and momentum for 130+ markets update continuously in the dashboard.Open AlphaPulse
The macro backdrop reinforces that pressure. The federal funds rate is projected at 3.726% in October 2026, down from 3.75% in September, with unemployment forecast near 4.09% after holding around 4.1% to 4.2% in recent months. That combination suggests a labor market that remains intact but no longer has the kind of income momentum that makes heavy borrowing comfortable. At the same time, consumer debt is still climbing, with disposable personal income projected at $24.2 trillion in July 2026 after reaching $23.97 trillion in April, a reminder that income growth is being absorbed by a still-costly credit environment rather than translating cleanly into easier affordability.
That matters economically because housing access is one of the main transmission channels from rates to the real economy. When DTI rises, households either buy smaller homes, delay purchases, or are forced into the rental market. That keeps demand pressure in place across apartments, insurance, furnishing, and renovation spending, while also limiting the upside for mortgage originators and homebuilders. It also means a stronger earnings profile for lenders depends less on volume and more on borrower quality, underwriting discipline and pricing power.
The pressure is visible in credit markets as well. Data from Adalytica’s Credit Card Usage Sentiment gauge shows “Extreme Greed” at 100, while the Wage Inflation Sentiment reading is also at 100, underscoring a disconnect between consumer spending appetite and the affordability of carrying debt. In plain terms, households are still leaning on credit, but the cost of doing so remains elevated.
That is why the story matters to investors across financials and housing. Capital One Financial has seen its shares recover from a spring weakness, closing at $201.34 on Oct. 23 after trading as low as $188.52 in February, but the stock remains below its 2026 highs and has been volatile around its 50-day and 200-day moving averages. Synchrony Financial, which is more exposed to revolving credit, has also been whipsawed, with its shares ending at $73.64 on Oct. 23 after falling below $68 in February. American Express has held up better, but even its recent move back above $313 came after a sharp selloff earlier in the year, reflecting investor sensitivity to consumer credit conditions.
The latest earnings reports reinforce the caution. Synchrony’s 10-Q showed credit card net charge-offs at a 4.77% annualized rate in the third quarter, a reminder that even relatively healthy consumers are feeling the strain. American Express disclosed $155 billion of customer deposits and consolidated debt at Sept. 30, highlighting the scale of funding needed to support card and lending operations in a more expensive rate regime.
For homebuyers, the practical takeaway is unchanged but more urgent: DTI is not just a bank metric, it is the pass-fail test for affordability. For investors, it is a read-through to consumer resilience, mortgage demand and credit quality. Unless borrowing costs fall further and wage gains outpace debt service, the DTI constraint is likely to remain one of the biggest brakes on housing demand into year-end and beyond.
| Entity | Gains | Losses |
|---|---|---|
| Lenders | ▲Higher pricing power | ▼More credit risk |
| Homebuyers | ▲Lower leverage temptation | ▼Tighter mortgage approval |
| Homebuilders | ▲Better-qualified buyers | ▼Slower sales volumes |
| Card issuers | ▲Interest income support | ▼Rising charge-off pressure |