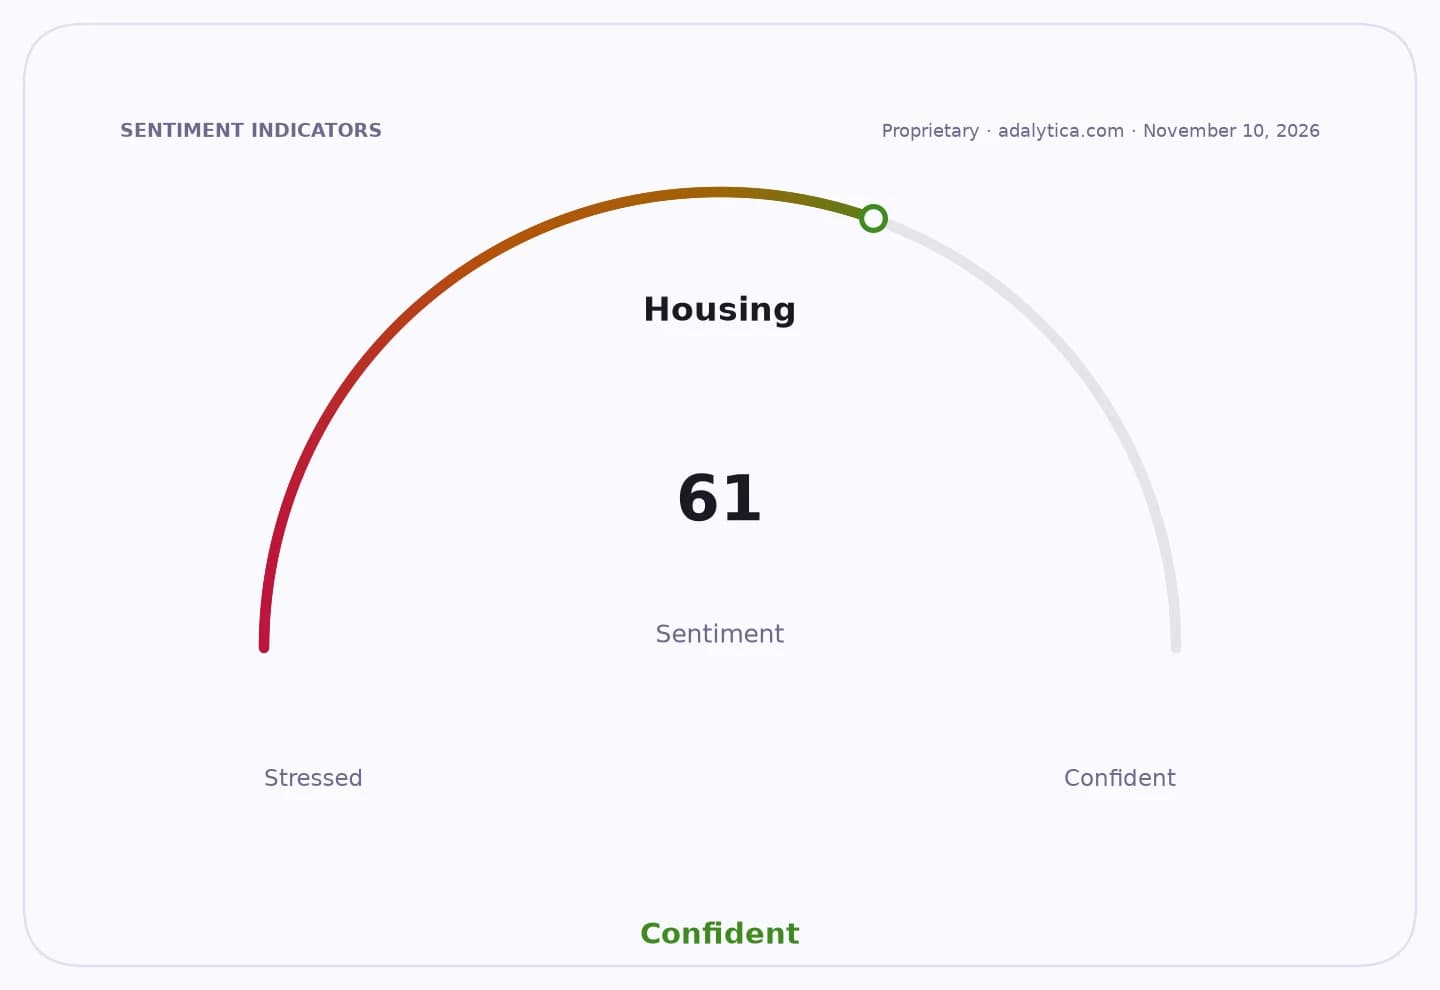
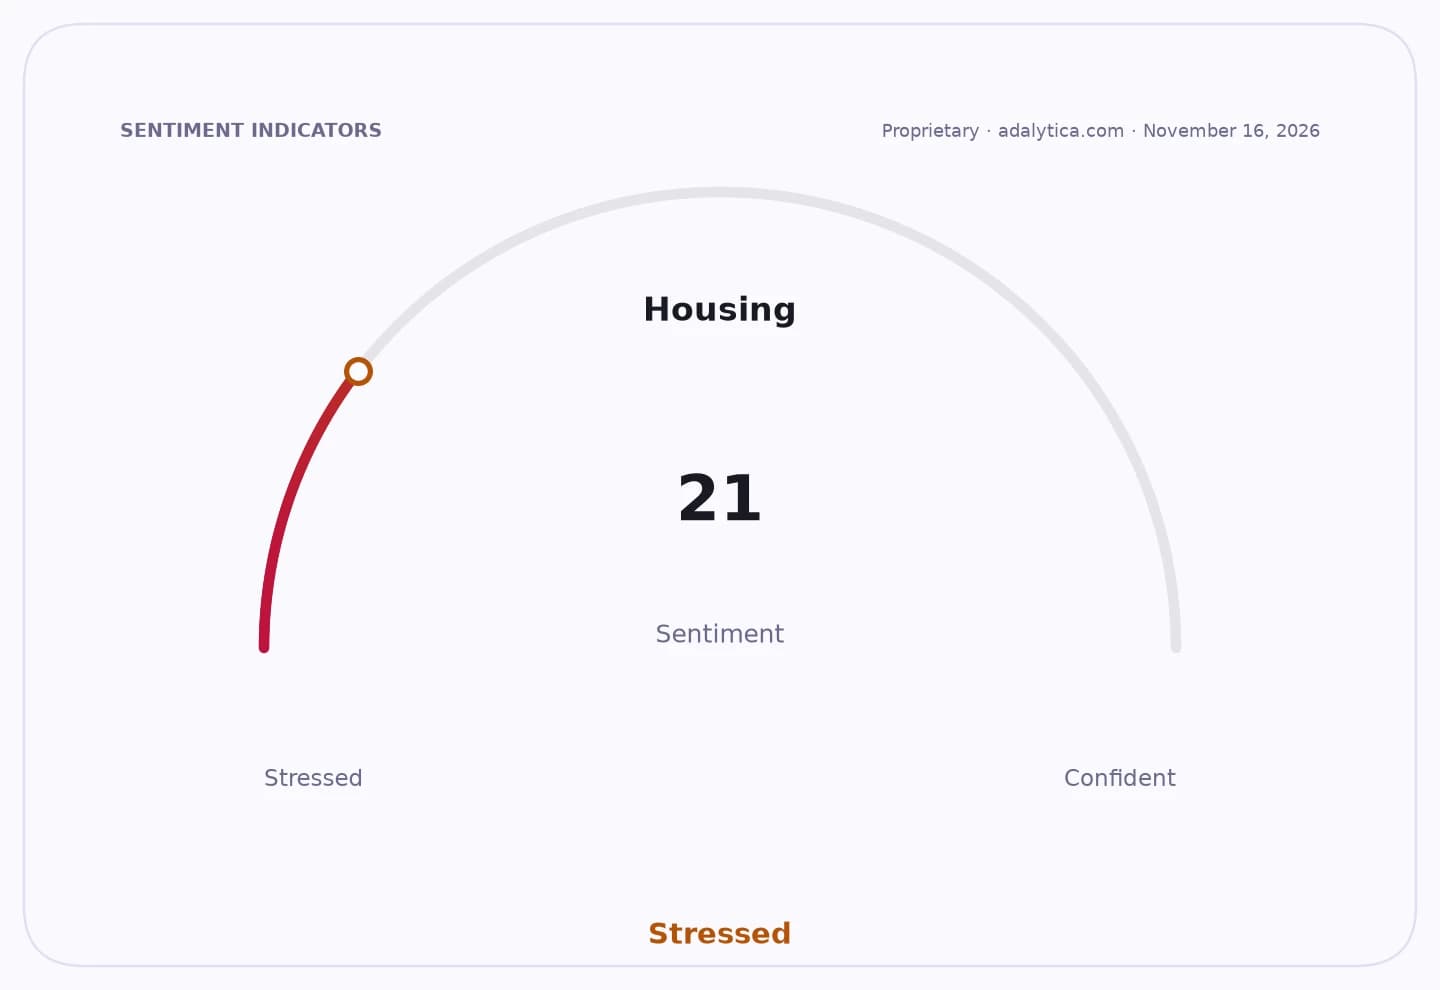
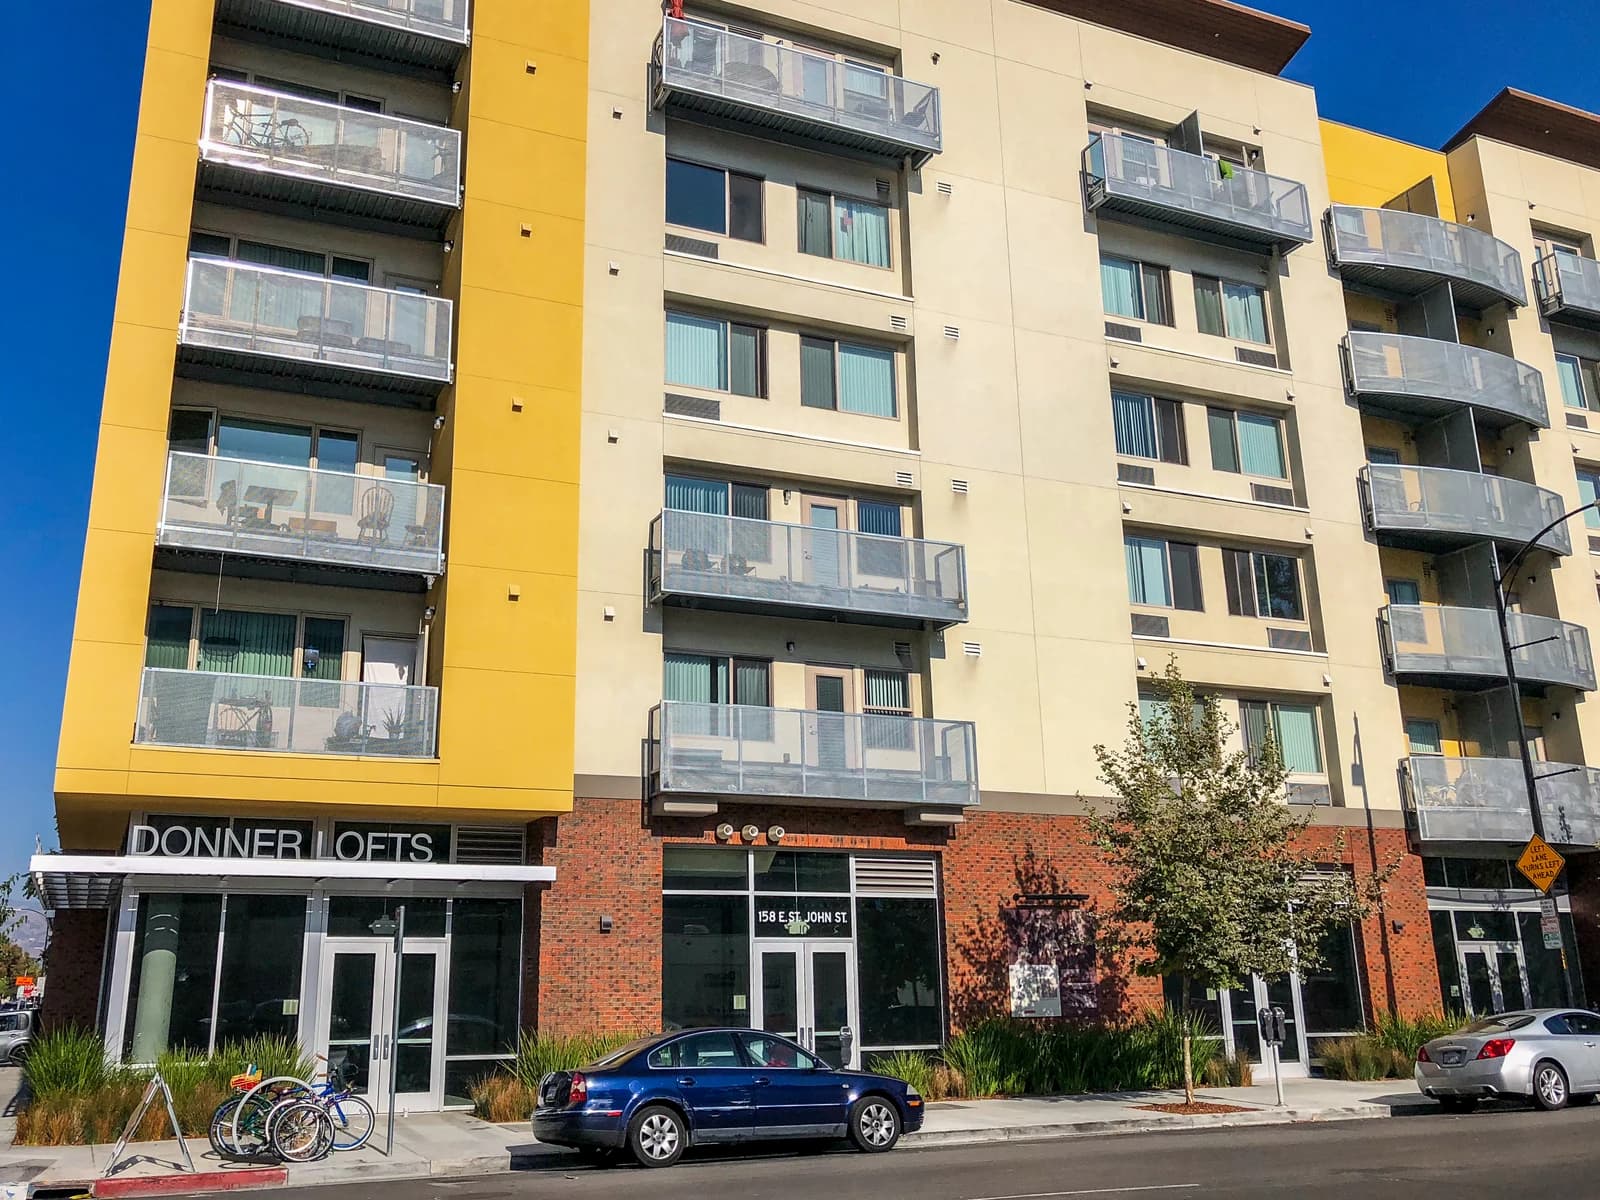
Higher borrowing costs are keeping housing affordability under pressure, and the gap between what lenders will approve and what households can comfortably pay remains wide.
Housing affordability calculator shows higher monthly costs
That is the real story behind a home affordability calculator like this one: the monthly payment, not the sticker price, determines whether a home fits into a household budget. In the sample calculation, a buyer earning $8,333 a month and carrying modest debt is shown a recommended home price of $368,829, with housing costs taking 30% of monthly income. That may sound manageable on paper, but the calculator also makes clear how quickly the math changes once taxes, insurance, debt payments and closing costs are added.
Sentiment Indicators
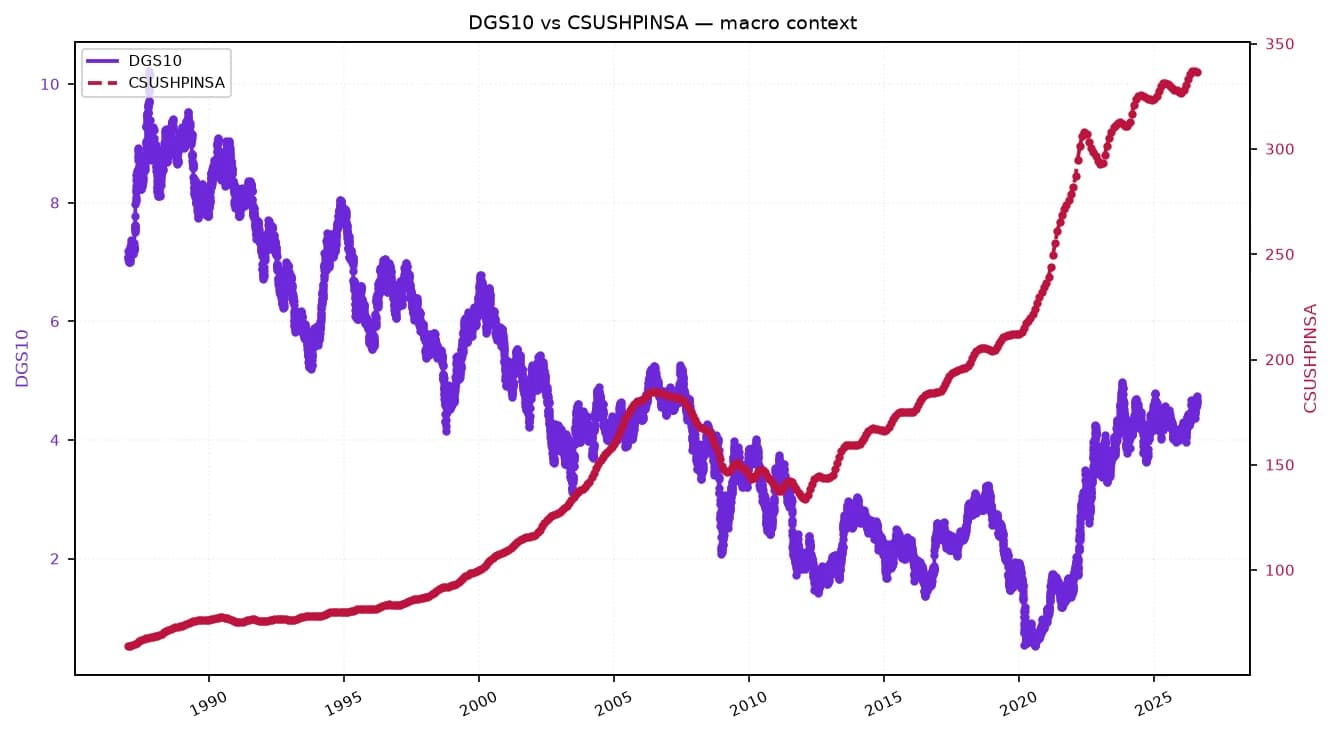
This matters because homeownership is being squeezed from both sides. Mortgage rates are still elevated, and with the 10-year U.S. Treasury yield forecast at 5.124%, financing costs are not offering much relief. At the same time, home prices remain high enough to leave many buyers stretched even before they start paying for maintenance, furniture or emergency savings. The result is a market where qualification is not the same thing as affordability.
For investors, that combination has consequences across housing-related assets. Builders, mortgage lenders, real estate brokerages and home improvement retailers all depend on a healthy flow of buyers who can comfortably move from renting to owning. When affordability weakens, demand gets pushed toward smaller homes, lower price points and longer decision timelines. That can slow turnover in existing-home sales and make consumers more cautious about big-ticket purchases tied to moving.
The data in the calculator also shows why the down payment still matters so much. A 3% conventional minimum, 3.5% FHA minimum or zero-down VA and USDA loans can open the door to ownership, but lower upfront cash usually means higher monthly payments and more financial strain over time. Closing costs of 2% to 5% of the loan amount can further raise the hurdle, especially for first-time buyers who may also need a cash cushion.
Broader housing data point to the same tension. The S&P CoreLogic Case-Shiller national home price index remains well above pre-pandemic levels, while new-home construction has cooled from recent highs. That mix suggests affordability is likely to stay a drag on transaction volumes even if price growth remains contained. In other words, the market may not need a crash to feel weak; it only needs enough rate pressure to keep buyers on the sidelines.
For long-term investors, that makes discipline more important than timing. Housing can be a powerful wealth builder, but only when the payment leaves room for saving, spending and handling surprises. Buyers should use calculators like this as a guardrail, not a green light to stretch. The healthiest approach is still the simplest: buy what you can truly afford, keep a cushion, and stay patient.
| Entity | Gains | Losses |
|---|---|---|
| Existing homeowners with fixed-rate mortgages | ▲Lower payment stability | ▼Less urgency to move |
| First-time buyers | ▲Better guidance on affordability | ▼Higher hurdle to entry |
| Homebuilders and lenders | ▲Demand for smaller, affordable homes | ▼Fewer stretched borrowers |
| Renters waiting to buy | ▲Time to save more cash | ▼Higher rents and delayed ownership |