The Nifty 50 slipped below its 50-day moving average and is hovering just above the psychologically important 24,000 mark, deepening a correction that has already dragged the index more than 3% below its June levels and left momentum indicators pointing lower.
Nifty 50 slips below 50-day moving average

That matters because the 50-day line is a widely watched gauge of intermediate trend strength, and a sustained break below it often forces systematic and discretionary investors to reassess exposure. The Nifty’s latest close at 24,078.3 leaves it almost flat versus the 24,000 threshold, but still well under its 50-day average of 24,083.17 and almost 3% below the 24,735.51 level on the 200-day moving average, underscoring that the index is now trading in a weaker technical band rather than merely pausing after a rally.
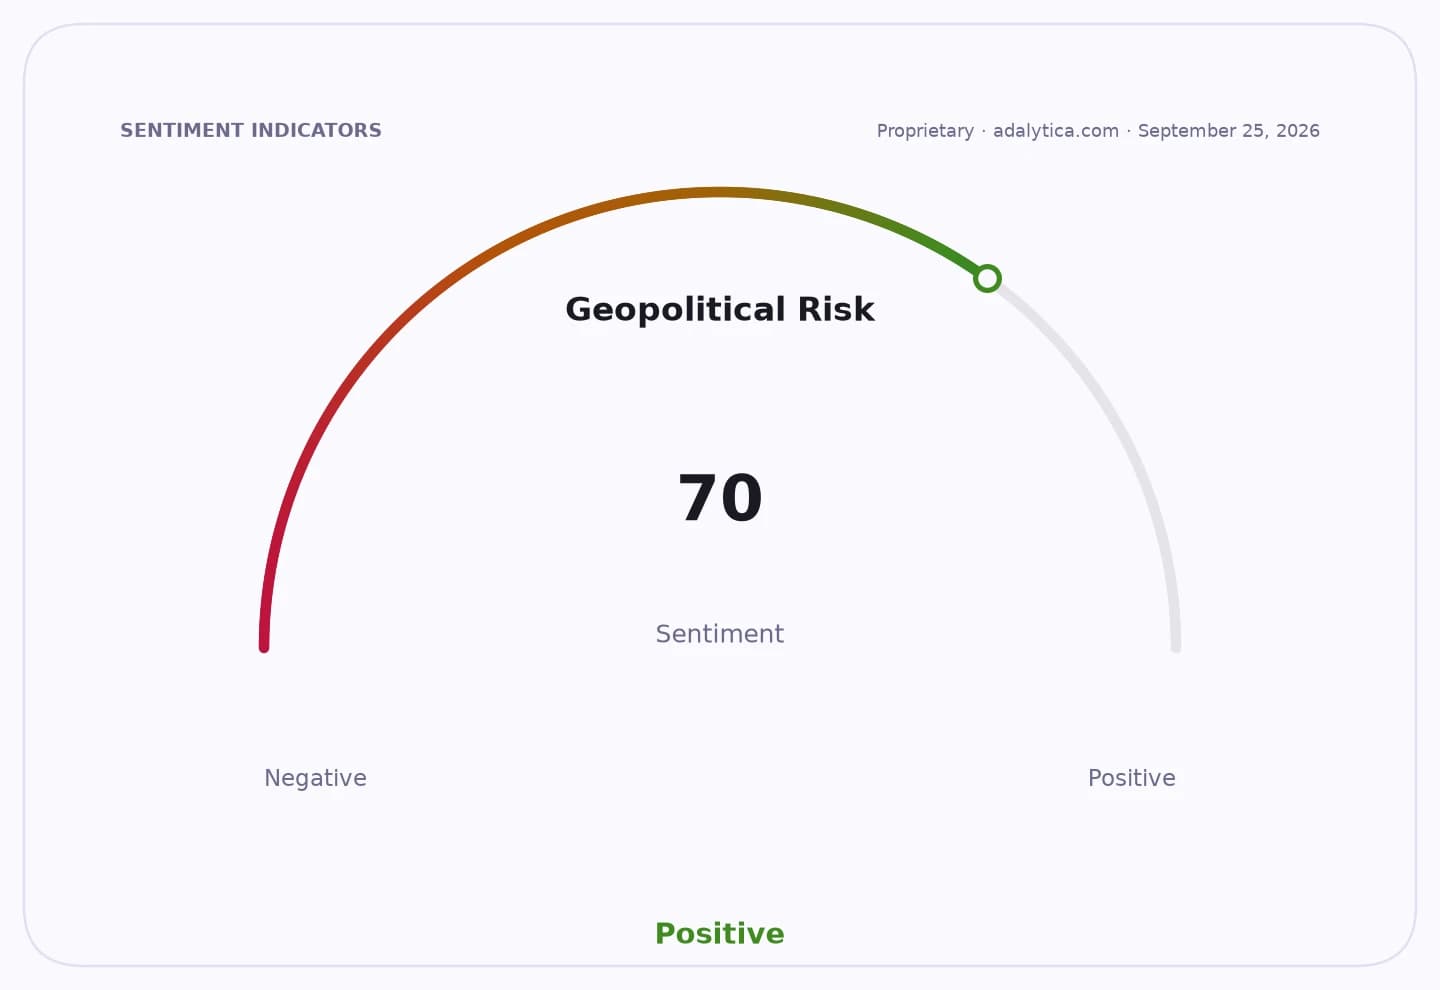
Sentiment IndicatorsⓘProprietary · adalytica.com · August 19, 2026
This is a snapshot — live sentiment, awareness and momentum for 130+ markets update continuously in the dashboard.Open AlphaPulse
The deterioration has been gradual but persistent. After peaking above 24,500 in April, the benchmark has failed to regain traction and has now lost nearly 500 points from its mid-August level of 24,576.6. The Relative Strength Index has cooled to 43.3 from 60.8 two sessions earlier, while the MACD has slipped below its signal line, both signs that near-term buying power is fading. The move also leaves the index only modestly above the lower Bollinger Band, suggesting the market is closer to oversold conditions than to a clean rebound.
For investors, the immediate question is whether 24,000 becomes a support floor or a trapdoor. A decisive hold could encourage dip buyers and short-covering, especially if global risk appetite stabilises. But a break lower would leave the June low around 23,824 exposed and could force further de-risking by momentum funds and tactical allocators. The backdrop from broader markets is not especially supportive: Adalytica’s S&P 500 trade signals show fear at 26, while the U.S. dollar has collapsed to an extreme-fear reading, hinting at a fragile global positioning environment rather than a clean pro-risk backdrop.
Foreign flows remain a key swing factor. The iShares MSCI India ETF, which tracks Indian equities for global investors, has held near 49.56, but that is still below its 200-day average of 50.76, indicating overseas appetite for India has not fully recovered. If the Nifty’s slide persists, it could reinforce caution among foreign portfolio investors already sensitive to valuation, earnings momentum and global rates. On the other hand, any stabilization above 24,000 may quickly attract value hunters given India’s relative growth premium versus other emerging markets.
The near-term narrative is therefore less about a single catalyst than about market structure. The index is approaching a technical inflection point where the battle between support at 24,000 and a deeper retracement toward 23,800 will determine whether this is an orderly correction or the start of a more extended de-rating.
| Entity | Gains | Losses |
|---|---|---|
| Dip buyers | ▲Lower entry levels | ▼Further downside if support breaks |
| Momentum sellers | ▲Short-term trend confirmation | ▼Risk of squeeze on bounce |
| Foreign investors in India | ▲Potential valuation reset | ▼Mark-to-market losses on weak flows |
| Nifty bulls | ▲Chance to defend 24,000 | ▼Loss of 50-DMA support |