Volodymyr Zelenskyy used the U.N. General Assembly to press world leaders to keep choking off Russia’s revenues, underscoring that the biggest economic lever in the war remains the global energy trade.
Russia sanctions keep oil and gas risk elevated
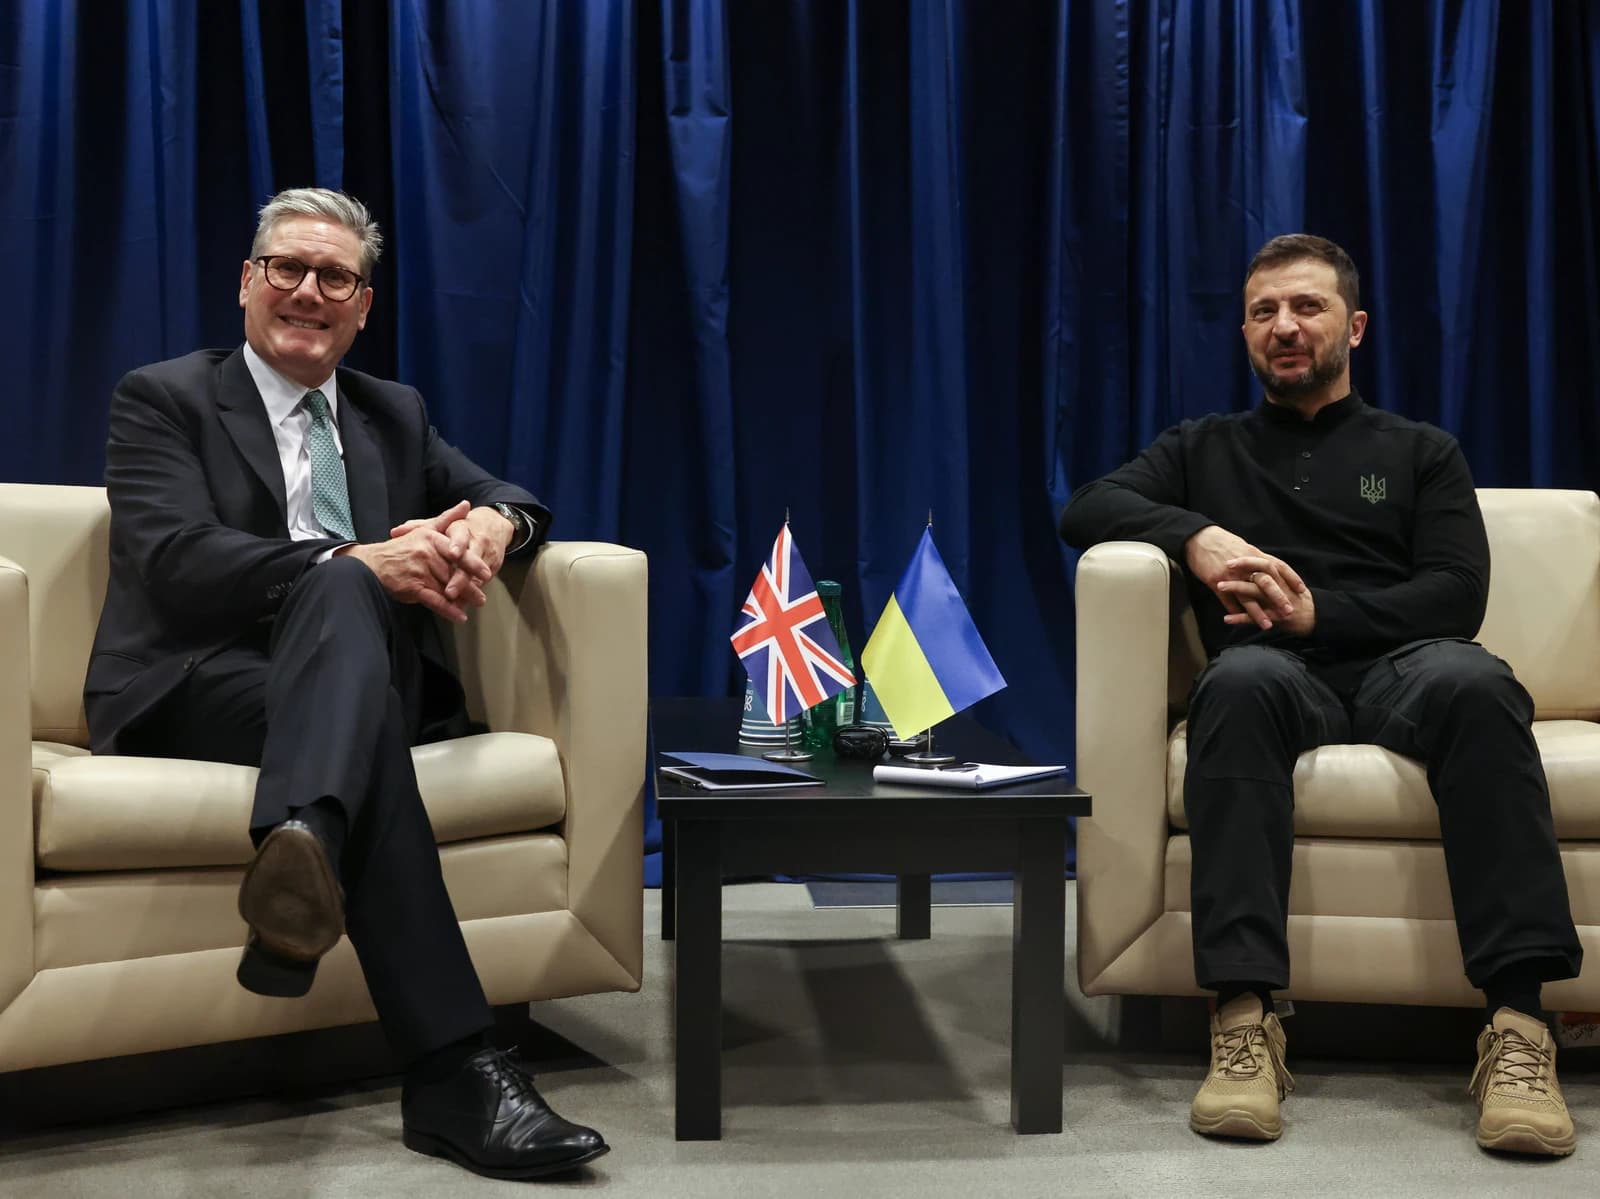
That matters because Russia’s war machine is still funded largely through oil and gas exports, and every barrel that clears the market helps extend a conflict that has already reshaped energy prices, fertilizer flows and grain shipments. For investors, the message is straightforward: sanctions pressure is not a side issue, it is a direct driver of crude risk premiums, commodity volatility and the valuation gap between energy producers and energy consumers.
Sentiment IndicatorsⓘProprietary · adalytica.com · September 28, 2026
This is a snapshot — live sentiment, awareness and momentum for 130+ markets update continuously in the dashboard.Open AlphaPulse
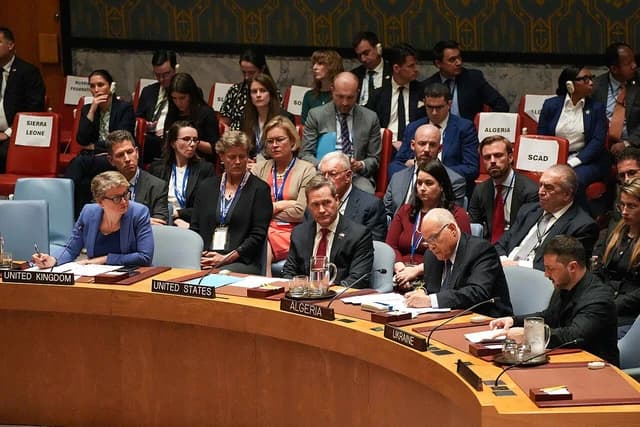
Zelenskyy said Russia’s revenues “must remain a target” and warned that trade with Moscow gives the war “more time.” The appeal came as Russia and Ukraine continue pounding each other with drones and missiles while front-line positions remain largely frozen, a battlefield stalemate that makes long-range economic warfare more important than territorial gains for now.
The market is already paying up for that risk. USO, the U.S. oil fund, has surged to 150.01, far above its 50-day moving average of 136.15 and 200-day average of 113.62, even after recent pullbacks. Its RSI reading near 53.6 shows the rally has cooled from overbought levels, but the broader trend still reflects a market that is pricing in persistent geopolitical supply risk. Adalytica’s Oil WTI Trade Signals snapshot also shows extreme greed, a sign that investors remain positioned for elevated crude prices rather than a quick normalization.
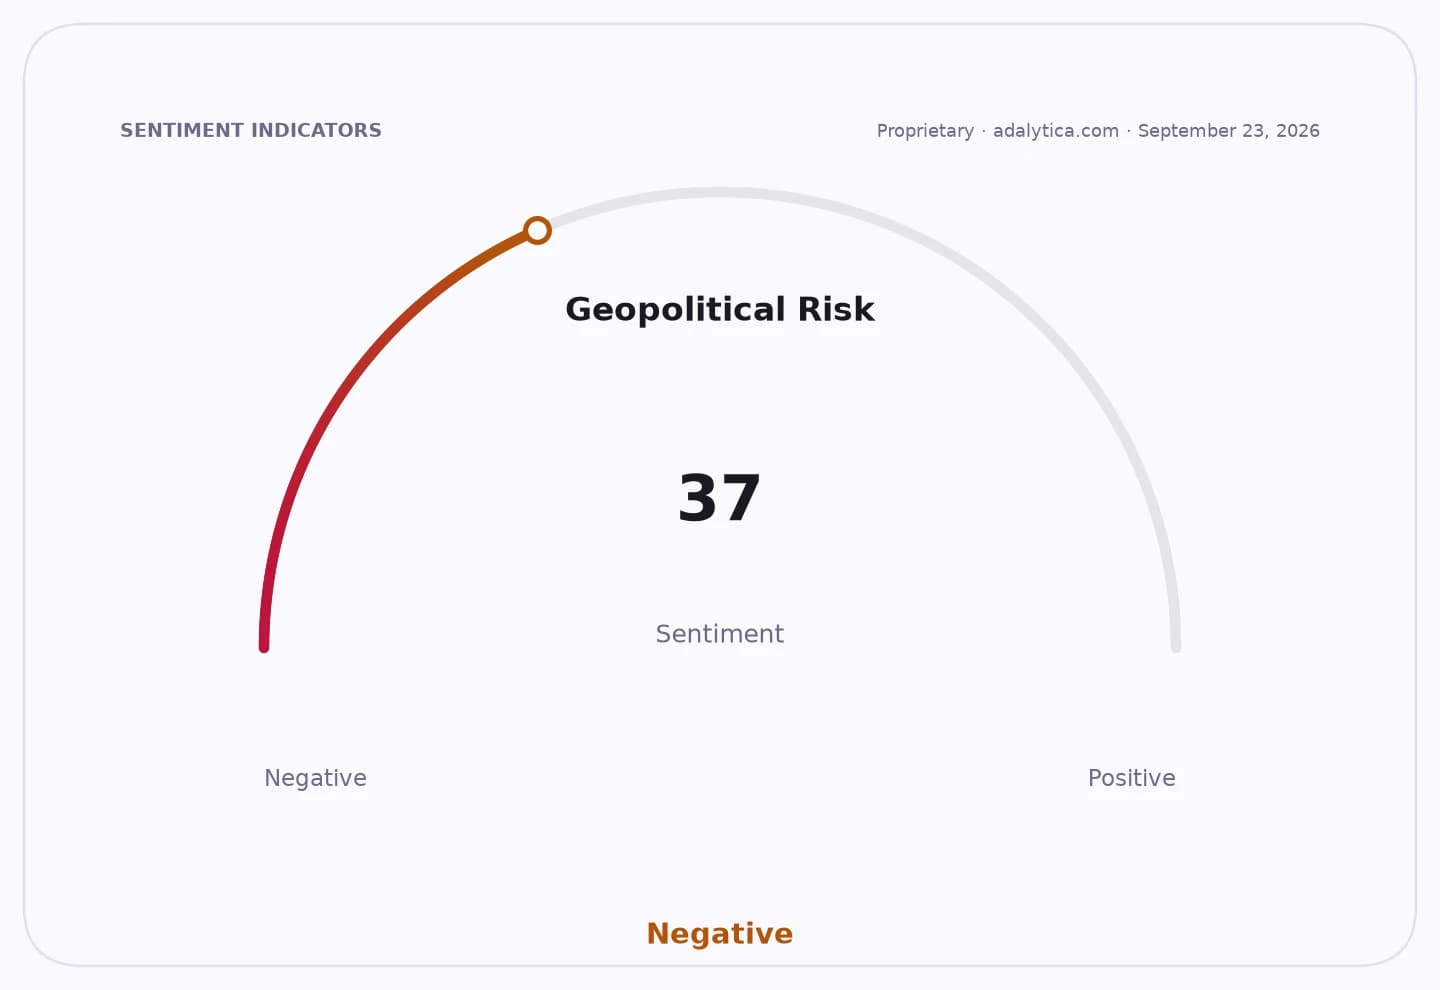
Geopolitical Risk — 30-day sentimentadalytica.com
Explore this data interactively — full history, time series and cross-market comparisons.Open AlphaPulse
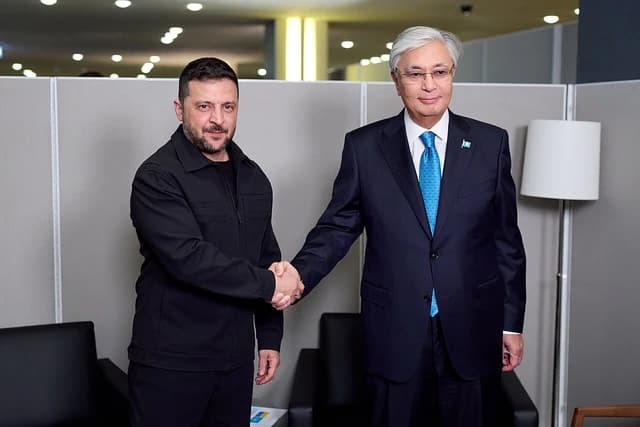
That is the trade the market underestimates. Sanctions headlines are often treated as diplomatic theater, but they can have real second-order effects on tanker routes, insurance costs, shadow flows and upstream capital plans. Chevron and Exxon Mobil have both flagged geopolitical volatility and sanctions as meaningful operational risks in recent filings, which is another way of saying the energy business still bends to politics when supply is tight and inventories are vulnerable.
Natural gas is a different but related channel. UNG, which tracks U.S. natural gas, has rebounded to 10.72, with the 50-day average at 10.29 and the 200-day average at 11.41. That places gas closer to a breakout zone than a collapse, and it reinforces the broader point: energy markets are not pricing a clean peace dividend, they are pricing a world where conflict remains sticky and sanctions remain a live policy tool.
The investment takeaway is clear. If Western governments keep tightening the noose on Russian revenues, the winners are not just headline oil producers but also the toll roads of the energy system — shale operators, pipeline names, tanker exposure and select commodity ETFs that benefit from sustained risk premiums. The losers are importers, airlines, industrial users and any portfolio that still assumes war risk will fade faster than diplomacy can deliver.
| Entity | Gains | Losses |
|---|---|---|
| Oil producers | ▲Higher crude pricing | ▼Demand destruction risk |
| Energy importers | ▲Temporary hedges | ▼Higher input costs |
| Tanker/shipping firms | ▲War-risk freight premiums | ▼Route disruption risk |
| Airlines/industrial users | ▲— | ▼Fuel-cost inflation |