Singapore’s retail sales growth cooled sharply in July, underscoring a softer consumer backdrop even as spending still managed a modest monthly gain.
Singapore retail sales growth slows in July

The Department of Statistics said retail sales rose 1.5% from a year earlier, down from 4% in June, while sales increased 0.9% on a seasonally adjusted monthly basis. Total retail sales were estimated at S$4.4 billion, with online purchases making up 15.4% of the total, easing from 16.4% in June.
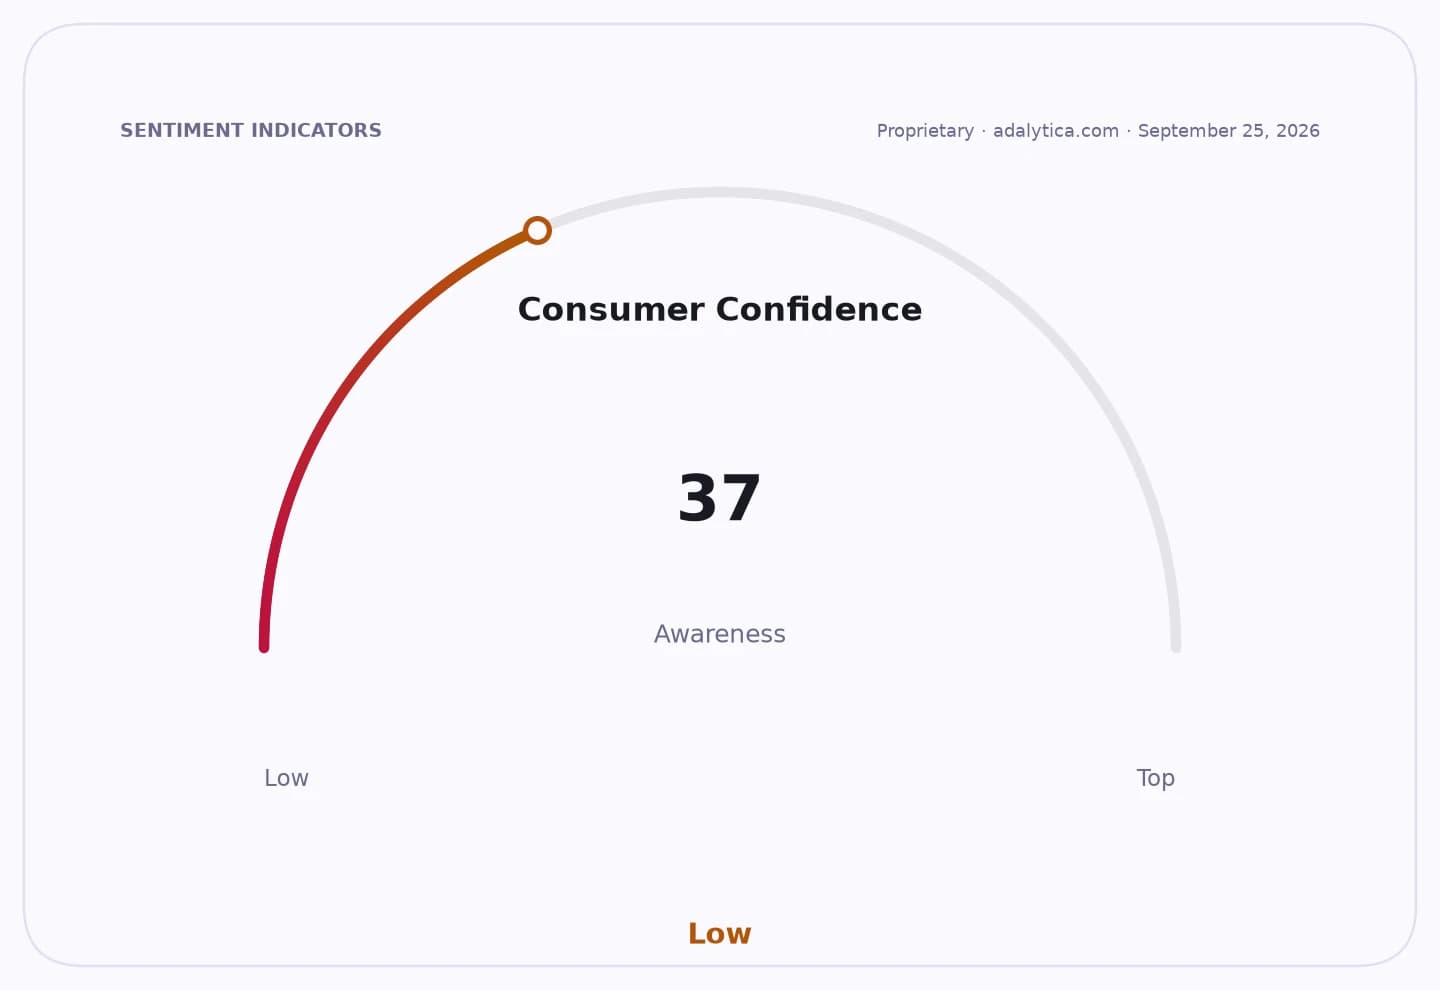
Sentiment IndicatorsⓘProprietary · adalytica.com · September 7, 2026
This is a snapshot — live sentiment, awareness and momentum for 130+ markets update continuously in the dashboard.Open AlphaPulse

The slowdown matters because retail demand is a key read on household confidence in trade-dependent Singapore, where consumers are sensitive to labor-market conditions, price pressures and global growth. A weaker pace of spending can also feed through to service-sector activity and near-term GDP momentum if it persists.
The July figures show the market was far from uniform. Recreational goods led annual growth with a 13.9% increase, followed by watches and jewelry at 11.1%, while computer and telecommunications equipment rose 5.1%. But food and alcohol sales fell 5.1% and department store sales declined 3.5%, suggesting households remained selective rather than broadly spending up.
For investors, the data points to a more uneven consumer environment for retailers, malls and discretionary names that rely on foot traffic and basket expansion. It also suggests online penetration is not accelerating in a straight line, even though e-commerce remains a meaningful share of sales.
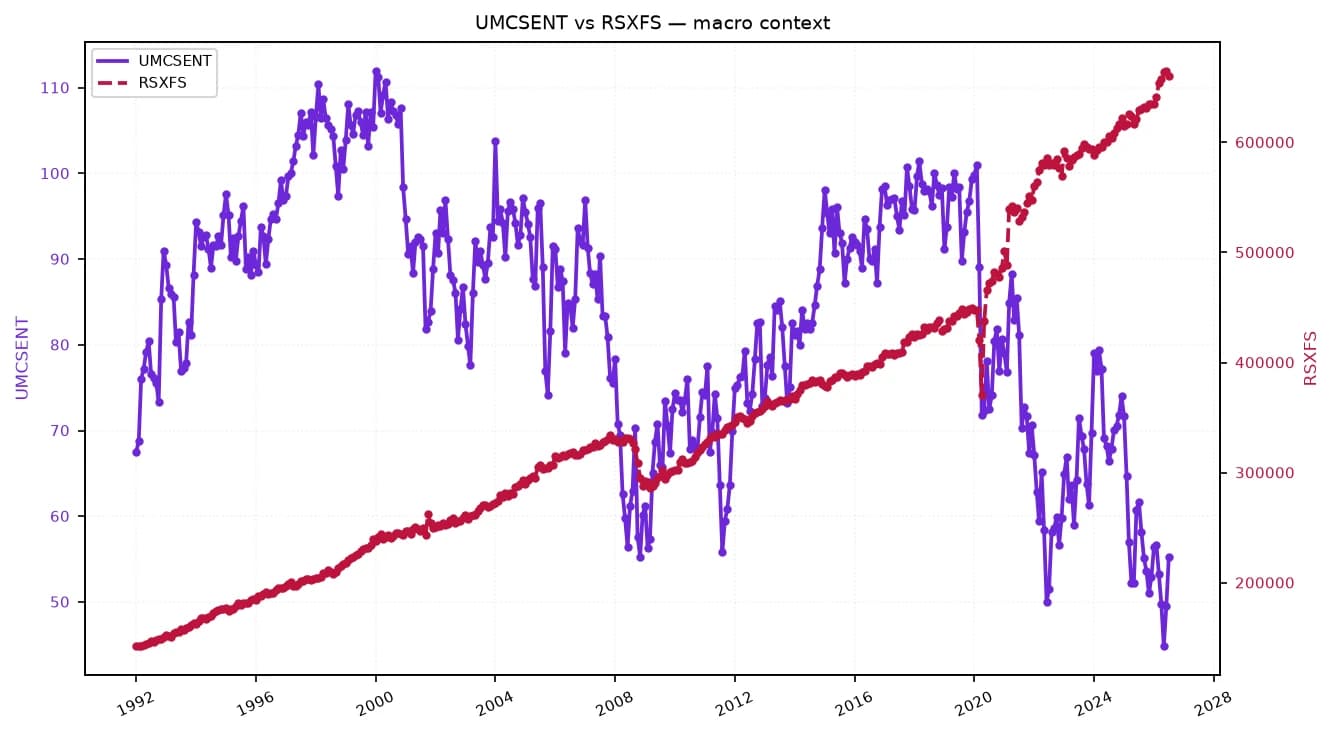
The reading comes as Adalytica’s Consumer Spending Sentiment gauge showed a sharp rebound, but its Consumer Confidence Recession Sentiment remained in extreme fear, highlighting how fragile the consumer picture still is. Markets will now look to the next set of Singapore macro releases for signs that July was a temporary pause or the start of a broader slowdown.
| Entity | Gains | Losses |
|---|---|---|
| Recreational goods retailers | ▲Higher discretionary spending | ▼Slower broad-based demand |
| Watches and jewelry sellers | ▲11.1% sales growth | ▼Weak mass-market categories |
| Food and alcohol retailers | ▲— | ▼5.1% sales decline |
| Department stores | ▲— | ▼3.5% sales decline |