Americans and Europeans don’t just shop differently — they live differently, and that gap is economically important because it shapes everything from inflation pressure to the winners and losers in retail, housing, transport and travel.
US vs Europe Household Spending Patterns
Official statistics show the clearest divide is in the household budget. In the European Union, nearly half of spending in 2025 went to food, housing and transport, with food the biggest single item at 16%, followed by housing, water and energy at 15% and transport at 15%, according to Eurostat. In the United States, the center of gravity is housing: 33% of household budgets went there in 2024, while transport accounted for 17% and food 13%, the U.S. Bureau of Labor Statistics said.
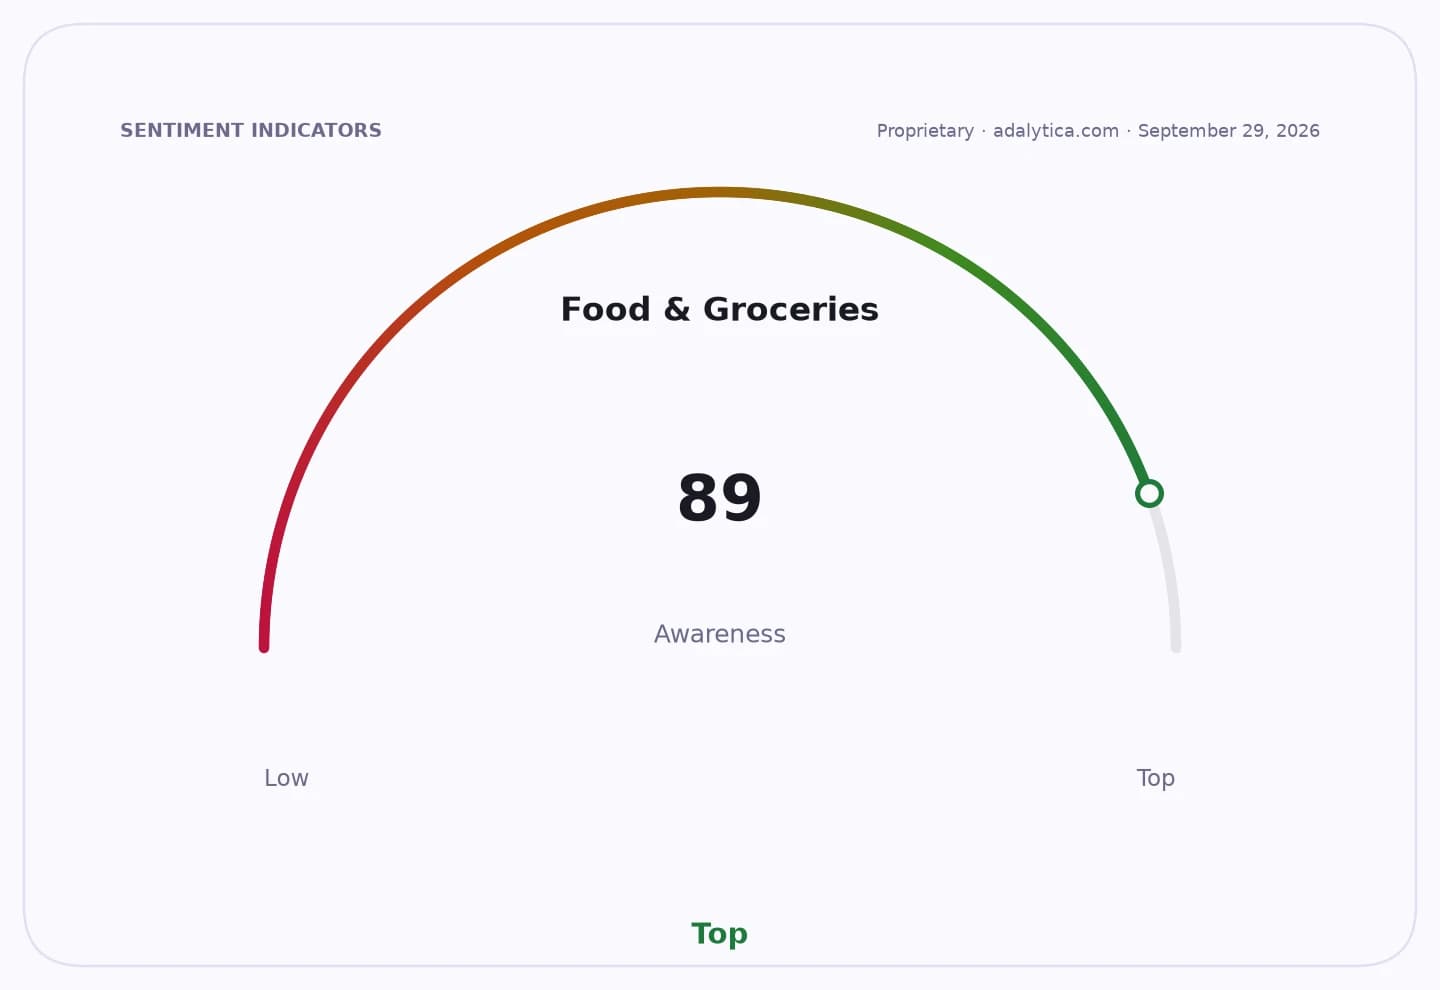
Sentiment IndicatorsⓘProprietary · adalytica.com · October 1, 2026
This is a snapshot — live sentiment, awareness and momentum for 130+ markets update continuously in the dashboard.Open AlphaPulse
That difference matters because it tells investors where consumer demand is structurally anchored. In America, the housing bill is the anchor on family finances, which means rent growth, mortgage rates and utilities can quickly ripple through discretionary spending. In Europe, a larger share of the wallet still goes to groceries, commuting and social life, which makes staples, public transit and leisure more important demand engines. The result is a very different consumption model on each side of the Atlantic.
The U.S. housing share is also a reminder of how persistent shelter inflation can be. Even when headline consumer price gains cool, housing costs tend to linger, and that keeps pressure on household budgets. For companies such as Amazon and Home Depot, the mix matters: Amazon benefits from a consumer base that still spends heavily online even when housing takes a larger bite, while Home Depot is more exposed to the health of the housing cycle and big-ticket renovation spending. Recent share-price swings in both stocks underscore how sensitive investors remain to that backdrop.
Europe’s heavier weight toward food and leisure tells a different story. Spending on restaurants and accommodation made up 10% of EU household expenditure last year, while recreation, sport and culture added 8%, according to Eurostat. That is a more social, experience-oriented pattern than the U.S. budget mix, and it helps explain why travel, hospitality and consumer-facing services can have a steadier cultural tailwind in Europe even when growth is sluggish.
The message for long-term investors is not that one region is “better” than the other, but that the business models winning in each market are different. U.S. investors should keep watching shelter inflation, wage growth and the affordability squeeze, because those determine how much discretionary spending survives after rent is paid. In Europe, the key question is whether consumers keep prioritizing everyday essentials and experiences even as energy costs and taxes weigh on take-home pay.
For patient investors, the broader takeaway is simple: spending patterns are durable competitive clues. Businesses tied to housing, food, transport and leisure don’t all move in the same direction, and the best portfolios are built by owning the ones with the strongest pricing power, the deepest moats and the most resilient demand. Worth watching for anyone building a portfolio over the next 3 to 10 years.
| Entity | Gains | Losses |
|---|---|---|
| U.S. landlords | ▲Higher rent spending | ▼Price-sensitive tenants |
| U.S. retailers | ▲Stronger online demand | ▼Households with tight budgets |
| European food and leisure firms | ▲Bigger budget share | ▼U.S.-style housing boom |
| Home improvement stocks | ▲Housing-linked demand | ▼Slowdown in home spending |